Farm & food prices · Prices farmers receive
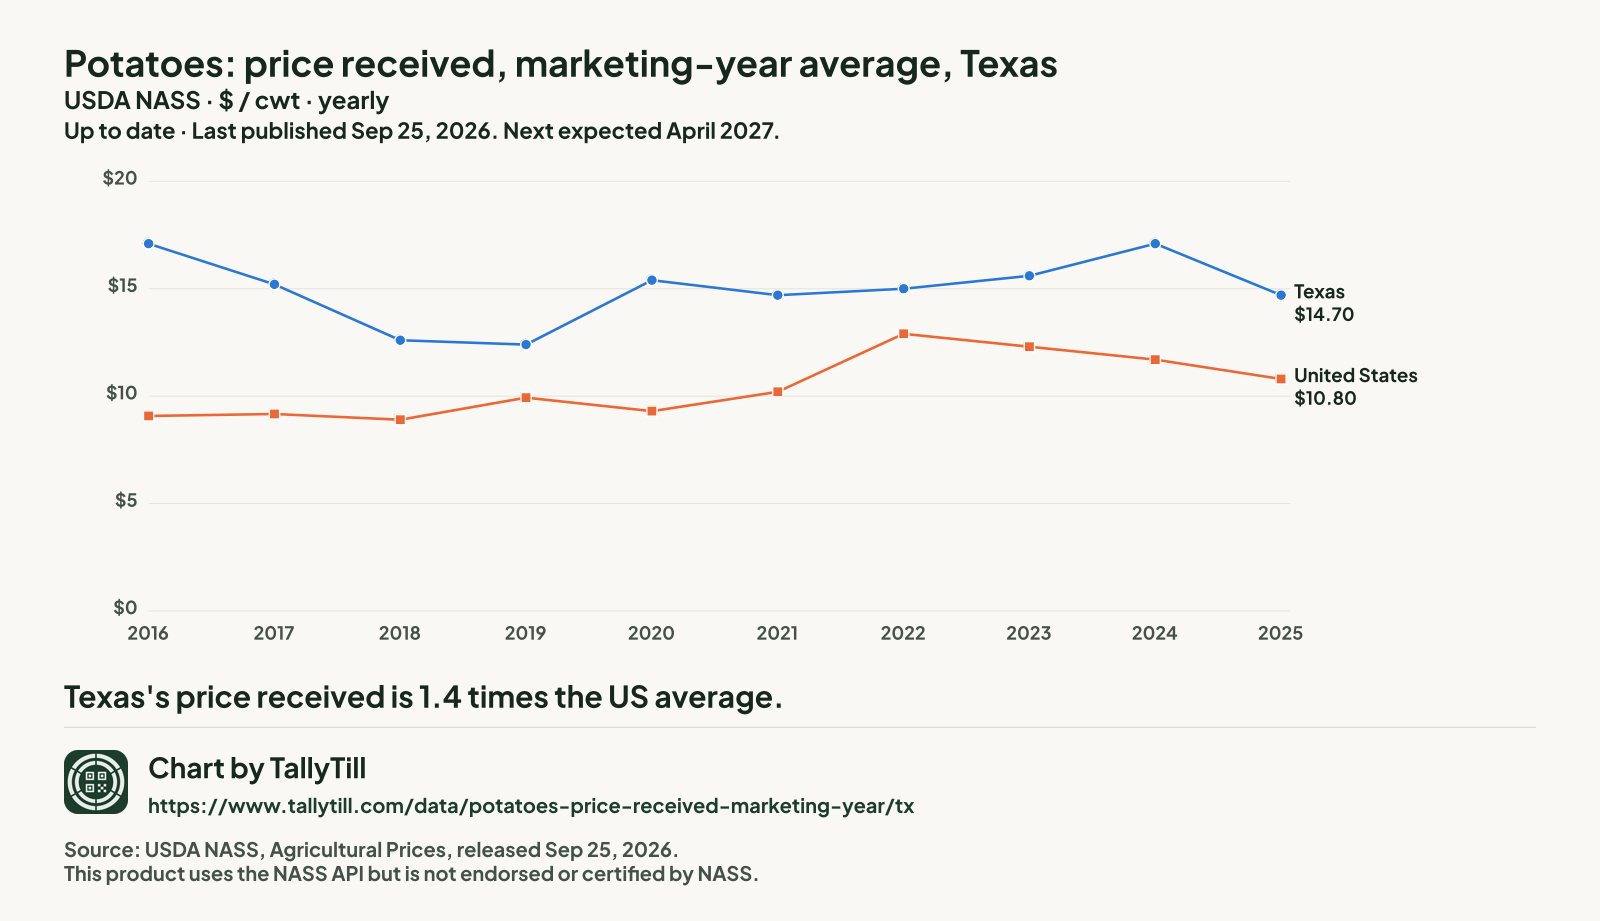
Potatoes: price received, marketing-year average: Texas
The average price farmers received per hundredweight for potatoes over each marketing year, from USDA's agricultural prices survey.
Up to dateYearly (marketing-year average). Last published Sep 25, 2026. Next expected April 2027.
The latest figures and how they have changed
Texas, 2025
$14.70 a hundredweight
Down 14.0% from $17.10 in 2024
United States, 2025
$10.80 a hundredweight
Down 7.7% from $11.70 in 2024
TexasUnited States
 Chart by TallyTill · tallytill.com
View the dataOpen every figure behind this chart in a table.Save imageSave this chart as a picture.
What the numbers say
- Texas's price received is 1.4 times the US average.
- Since 2016 it has fallen 14.0%, from $17.10 to $14.70 a hundredweight.
Every figure behind this chart
| Year | Texas | United States |
|---|---|---|
| 2025 | $14.70 | $10.80 |
| 2024 | $17.10 | $11.70 |
| 2023 | $15.60 | $12.30 |
| 2022 | $15 | $12.90 |
| 2021 | $14.70 | $10.20 |
| 2020 | $15.40 | $9.30 |
| 2019 | $12.40 | $9.93 |
| 2018 | $12.60 | $8.90 |
| 2017 | $15.20 | $9.17 |
| 2016 | $17.10 | $9.08 |
ComparePut this series on one chart with another, and see whether the two can be compared.
Share chartGet a link and a preview picture of this chart to share.
Embed this chartGet the code to show this chart on your own website.
Source: USDA National Agricultural Statistics Service (NASS), Agricultural Prices Survey. State and US estimates released Sep 25, 2026. Quick Stats item "POTATOES - PRICE RECEIVED, MEASURED IN $ / CWT". Retrieved Oct 23, 2026; snapshot 2026-10-23.1. Dollars as published, not adjusted for inflation. This product uses the NASS API but is not endorsed or certified by NASS.
What this measures
It is USDA's average for a whole marketing year, weighted by how much of it sold in each month of the marketing year, so it is not the average of the monthly prices.