Farm & food prices · Farm costs and income
Cash receipts: poultry and eggs: Pennsylvania
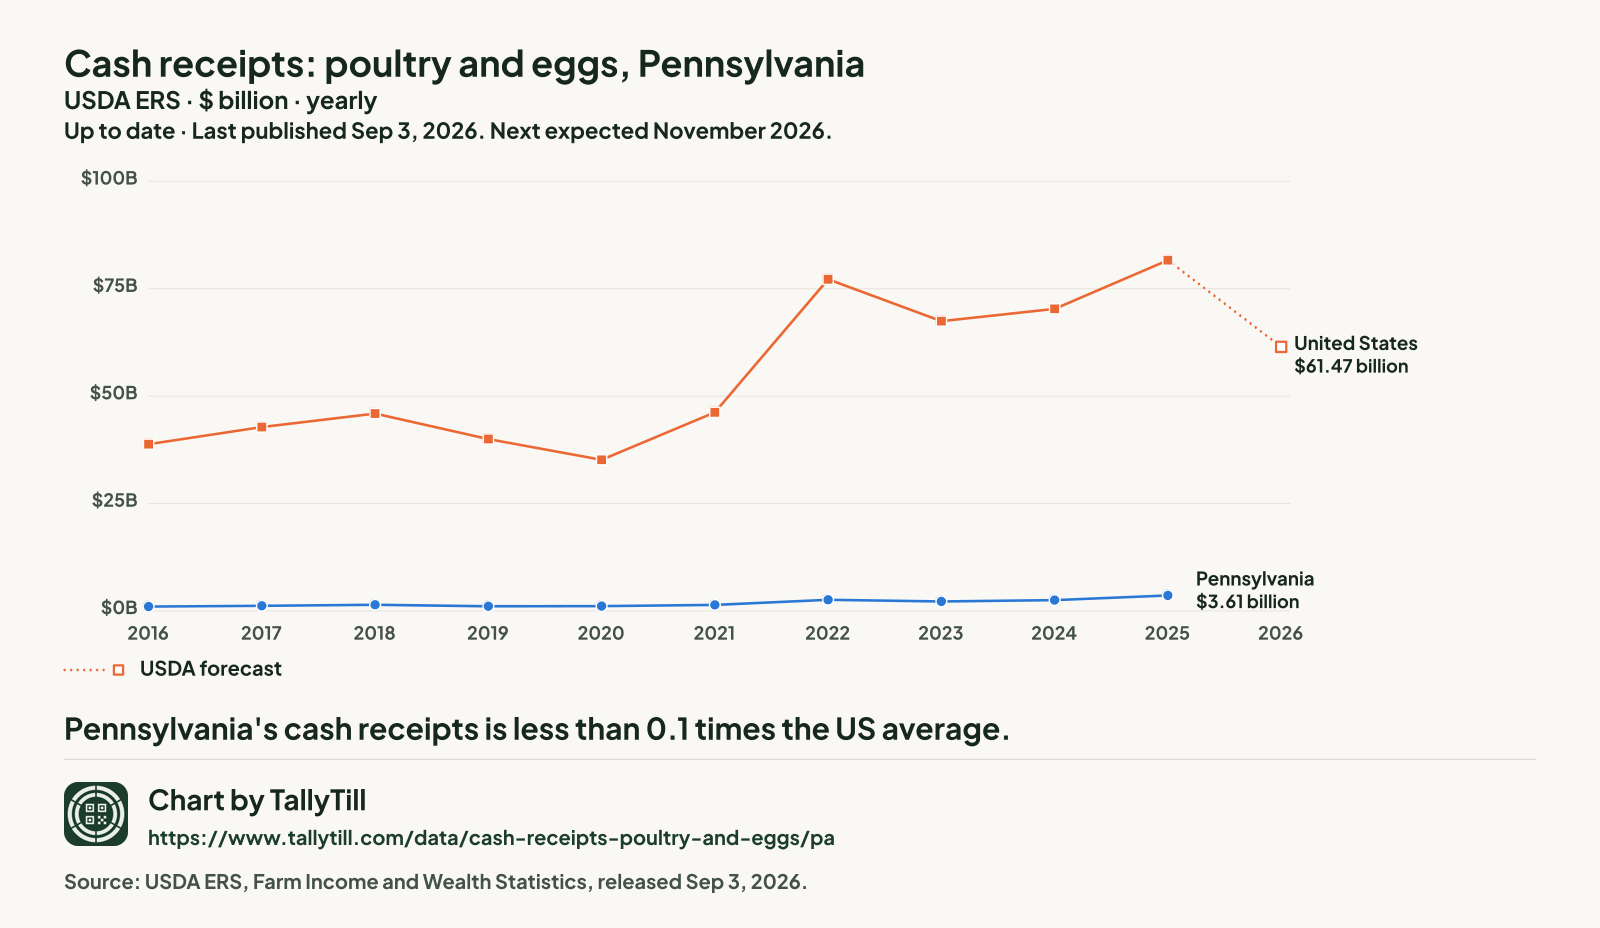
What US farms took in from selling poultry and eggs each year, in billions of dollars, with USDA's forecast for the nation's current year.
Up to dateThree times a year: in February, around the start of September and around the start of December. Last published Sep 3, 2026. Next expected November 2026.
The latest figures and how they have changed
Pennsylvania, 2025
$3.61 billion
Up 43.5% from $2.52 billion in 2024
United States, 2025
$81.66 billion
Up 16.1% from $70.31 billion in 2024
PennsylvaniaUnited StatesUSDA forecast
 Chart by TallyTill · tallytill.com
View the dataOpen every figure behind this chart in a table.Save imageSave this chart as a picture.
What the numbers say
- Pennsylvania's cash receipts is less than 0.1 times the US average.
- Since 2016 it has risen 253.7%, from $1.02 billion to $3.61 billion.
Every figure behind this chart
| Year | Pennsylvania | United States |
|---|---|---|
| 2026 | No figure | $61.47 billion (USDA forecast) |
| 2025 | $3.61 billion | $81.66 billion |
| 2024 | $2.52 billion | $70.31 billion |
| 2023 | $2.20 billion | $67.45 billion |
| 2022 | $2.59 billion | $77.21 billion |
| 2021 | $1.40 billion | $46.22 billion |
| 2020 | $1.10 billion | $35.17 billion |
| 2019 | $1.08 billion | $40.00 billion |
| 2018 | $1.42 billion | $45.96 billion |
| 2017 | $1.18 billion | $42.79 billion |
| 2016 | $1.02 billion | $38.80 billion |
ComparePut this series on one chart with another, and see whether the two can be compared.
Share chartGet a link and a preview picture of this chart to share.
Embed this chartGet the code to show this chart on your own website.
Source: USDA Economic Research Service (ERS), Farm Income and Wealth Statistics. State and US estimates released Sep 3, 2026. Retrieved Oct 21, 2026; snapshot 2026-10-21.1. Dollars as published, not adjusted for inflation.
What this measures
It is the money farms received from selling these products, before any costs, and the nation's latest year is a USDA forecast.