Cash rent for irrigated cropland: Costilla County, Colorado
The average cash rent farmers paid per acre for irrigated cropland, from USDA's yearly cash rents survey.
The latest figures and how they have changed
 Chart by TallyTill · tallytill.com
What the numbers say
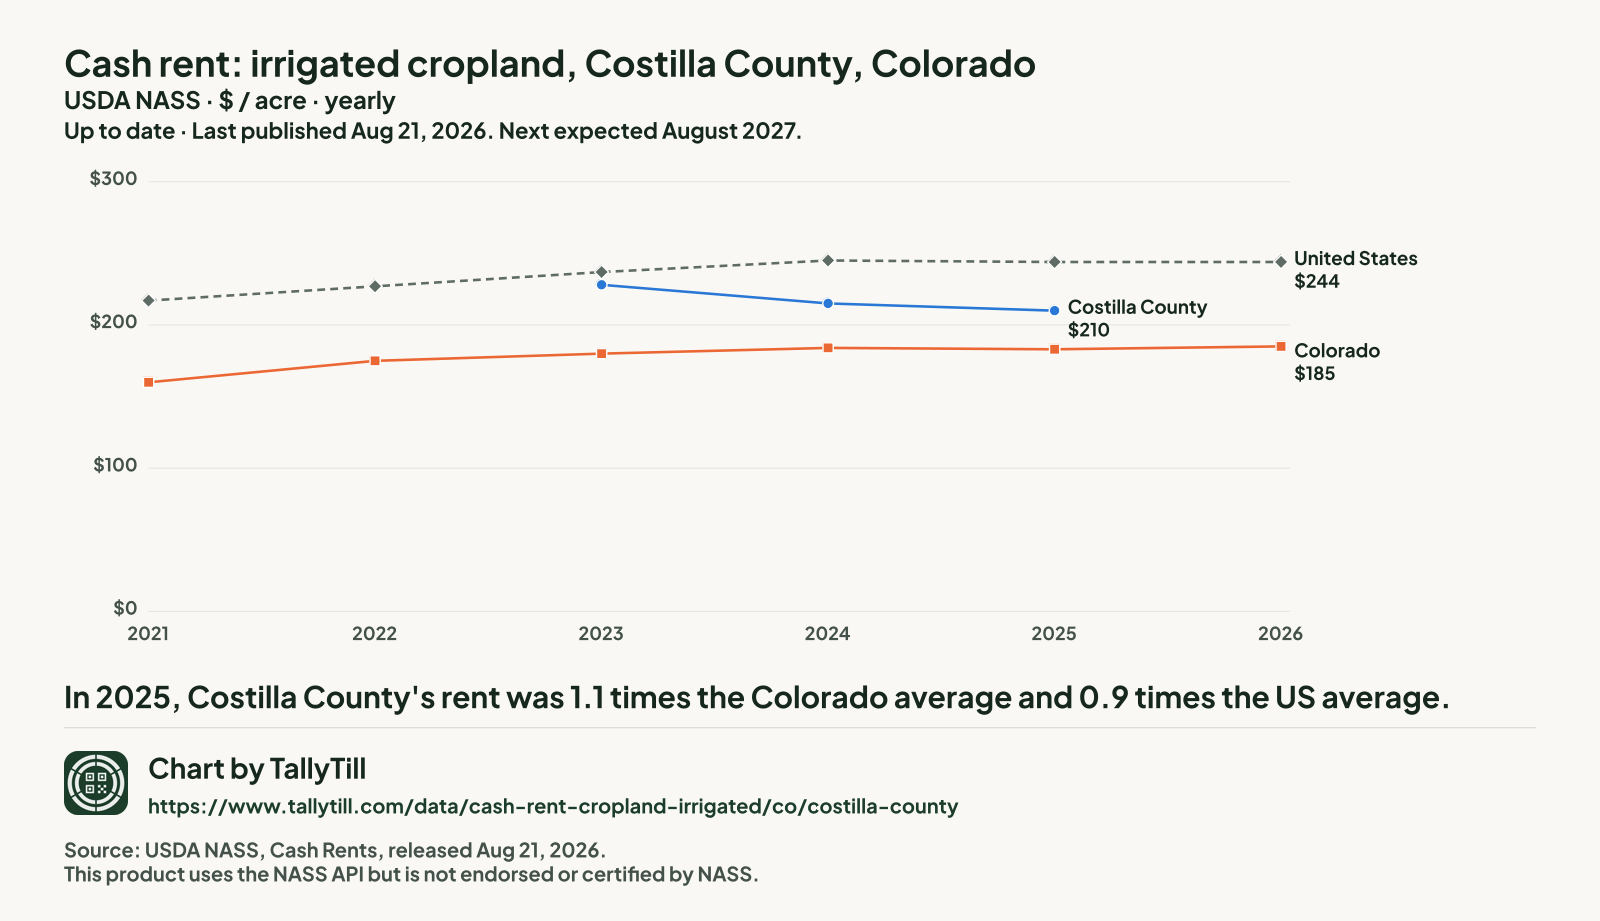
- In 2025, Costilla County's rent was 1.1 times the Colorado average and 0.9 times the US average.
- It is the 4th highest of the 32 Colorado counties NASS published for 2025.
- From 2023 to 2025 it fell 7.9%, from $228 to $210 an acre.
- Gaps are years with no separate Costilla figure: in 2021, 2022 and 2026 NASS combined Costilla into "other counties". Nothing is filled in.
Every figure behind this chart
| Year | Costilla County | Colorado | United States |
|---|---|---|---|
| 2026 | Combined into "other counties" | $185 | $244 |
| 2025 | $210 | $183 | $244 |
| 2024 | $215 | $184 | $245 |
| 2023 | $228 | $180 | $237 |
| 2022 | Combined into "other counties" | $175 | $227 |
| 2021 | Combined into "other counties" | $160 | $217 |
Every Colorado county, 2026
Darker shading means a higher figure. Values run from $33 an acre in Park County to $290 an acre in Yuma County.
- Under $96.50 (6 counties)
- $96.50 to under $138 (6 counties)
- $138 to under $178 (6 counties)
- $178 to under $206 (6 counties)
- $206 and over (6 counties)
- Not published separately (34 counties, $96.50 an acre combined)
NASS combined Arapahoe County, Archuleta County, Baca County, Broomfield County, Cheyenne County, Clear Creek County, Costilla County, Crowley County, Custer County, Denver County, Dolores County, Douglas County, Eagle County, El Paso County, Elbert County, Garfield County, Gilpin County, Grand County, Hinsdale County, Huerfano County, Jackson County, Jefferson County, Kiowa County, Lake County, Lincoln County, Mineral County, Moffat County, Ouray County, Pitkin County, Routt County, San Juan County, San Miguel County, Summit County and Teller County into "other counties", so they have no figure of their own.
Costilla: not published separately.
| Rank | County | Figure (dollars an acre) | Precision (CV) |
|---|---|---|---|
| 1 | Yuma County | $290 | 14.6% |
| 2 | Phillips County | $257 | 7.5% |
| 3 | Logan County | $234 | 7.1% |
| 4 | Rio Grande County | $220 | 17.6% |
| 5 | Washington County | $214 | 11.5% |
| 6 | Morgan County | $206 | 7.0% |
| 7 | Weld County | $202 | 7.5% |
| 8 | Larimer County | $195 | 7.3% |
| 9 | Alamosa County | $191 | 24.6% |
| 10 | Saguache County | $189 | 12.6% |
| 11 | Bent County | $178 | 11.7% |
| 11 | Sedgwick County | $178 | 10.9% |
| 13 | Pueblo County | $175 | 7.9% |
| 14 | Kit Carson County | $170 | 6.7% |
| 15 | Otero County | $155 | 14.8% |
| 16 | Prowers County | $154 | 8.5% |
| 17 | Adams County | $146 | 22.5% |
| 18 | Montrose County | $138 | 14.4% |
| 19 | Montezuma County | $135 | 9.6% |
| 20 | Conejos County | $134 | 8.6% |
| 21 | Las Animas County | $122 | 9.7% |
| 22 | Delta County | $120 | 10.7% |
| 23 | Mesa County | $113 | 15.0% |
| 24 | Boulder County | $96.50 | 7.0% |
| 25 | Rio Blanco County | $86.50 | 7.0% |
| 26 | La Plata County | $81.50 | 11.6% |
| 27 | Fremont County | $67 | 7.6% |
| 28 | Chaffee County | $61 | 10.1% |
| 29 | Gunnison County | $54 | 9.3% |
| 30 | Park County | $33 | 8.2% |
What this measures
NASS asks farm operators what they pay in cash rent per acre, separately for irrigated cropland, non-irrigated cropland and pasture. State figures come out at the end of July; county figures follow in August. When too few farms in a county answer, NASS combines that county with others and publishes one "other counties" figure, so some counties have no figure of their own.