Cash rent for irrigated cropland: Sumter County, Georgia
The average cash rent farmers paid per acre for irrigated cropland, from USDA's yearly cash rents survey.
The latest figures and how they have changed
 Chart by TallyTill · tallytill.com
What the numbers say
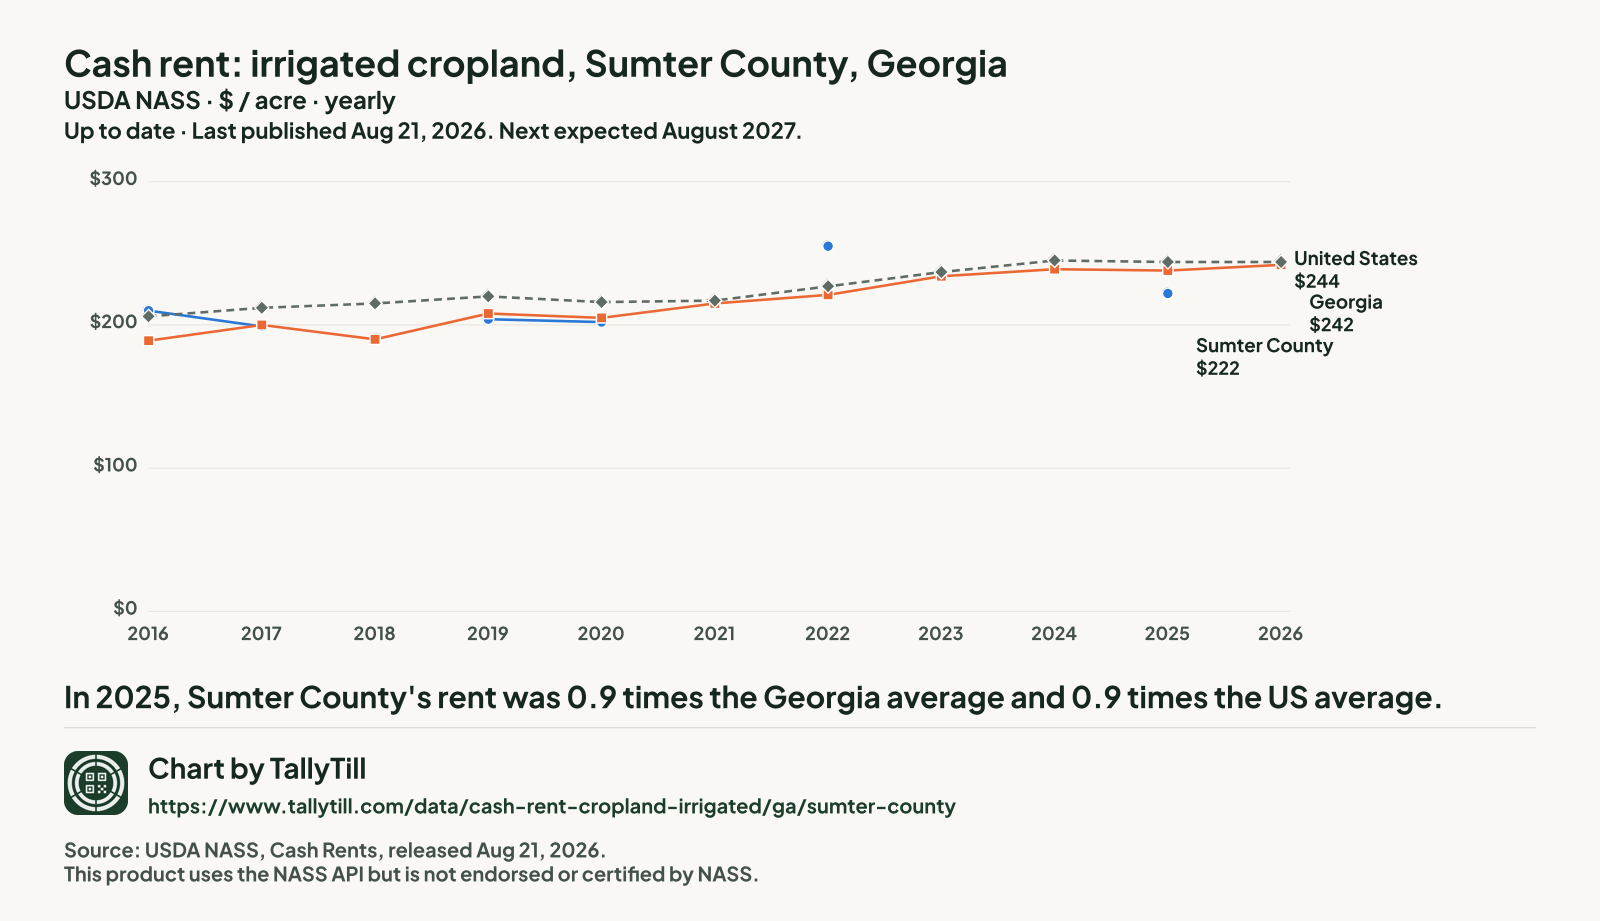
- In 2025, Sumter County's rent was 0.9 times the Georgia average and 0.9 times the US average.
- It is the 16th lowest of the 37 Georgia counties NASS published for 2025.
- From 2016 to 2025 it rose 5.7%, from $210 to $222 an acre.
- Gaps are years with no separate Sumter figure: NASS ran no county survey in 2018, and in 2021, 2023, 2024 and 2026 it combined Sumter into "other counties". Nothing is filled in.
Every figure behind this chart
| Year | Sumter County | Georgia | United States |
|---|---|---|---|
| 2026 | Combined into "other counties" | $242 | $244 |
| 2025 | $222 | $238 | $244 |
| 2024 | Combined into "other counties" | $239 | $245 |
| 2023 | Combined into "other counties" | $234 | $237 |
| 2022 | $255 | $221 | $227 |
| 2021 | Combined into "other counties" | $215 | $217 |
| 2020 | $202 | $205 | $216 |
| 2019 | $204 | $208 | $220 |
| 2018 | No county survey that year | $190 | $215 |
| 2017 | $199 | $200 | $212 |
| 2016 | $210 | $189 | $206 |
Every Georgia county, 2026
Darker shading means a higher figure. Values run from $152 an acre in Stewart County to $303 an acre in Grady County.
- Under $200 (7 counties)
- $200 to under $221 (8 counties)
- $221 to under $251 (8 counties)
- $251 to under $266 (8 counties)
- $266 and over (8 counties)
- Not published separately (120 counties, $222 an acre combined)
NASS combined Appling County, Baldwin County, Banks County, Barrow County, Bartow County, Bibb County, Brantley County, Bryan County, Butts County, Camden County, Candler County, Carroll County, Catoosa County, Charlton County, Chatham County, Chattahoochee County, Chattooga County, Cherokee County, Clarke County, Clay County, Clayton County, Clinch County, Cobb County, Columbia County, Coweta County, Crawford County, Crisp County, Dade County, Dawson County, DeKalb County, Dooly County, Dougherty County, Douglas County, Echols County, Effingham County, Elbert County, Emanuel County, Evans County, Fannin County, Fayette County, Floyd County, Forsyth County, Franklin County, Fulton County, Gilmer County, Glascock County, Glynn County, Gordon County, Greene County, Gwinnett County, Habersham County, Hall County, Hancock County, Haralson County, Harris County, Hart County, Heard County, Henry County, Houston County, Jackson County, Jasper County, Jenkins County, Johnson County, Jones County, Lamar County, Lanier County, Liberty County, Lincoln County, Long County, Lowndes County, Lumpkin County, Madison County, Marion County, McDuffie County, McIntosh County, Meriwether County, Monroe County, Montgomery County, Morgan County, Murray County, Muscogee County, Newton County, Oconee County, Oglethorpe County, Paulding County, Peach County, Pickens County, Pierce County, Pike County, Polk County, Putnam County, Quitman County, Rabun County, Richmond County, Rockdale County, Schley County, Spalding County, Stephens County, Sumter County, Talbot County, Taliaferro County, Taylor County, Telfair County, Towns County, Treutlen County, Troup County, Union County, Upson County, Walker County, Walton County, Ware County, Warren County, Washington County, Wayne County, Webster County, Wheeler County, White County, Whitfield County, Wilkes County and Wilkinson County into "other counties", so they have no figure of their own.
Sumter: not published separately.
| Rank | County | Figure (dollars an acre) | Precision (CV) |
|---|---|---|---|
| 1 | Grady County | $303 | 2.6% |
| 2 | Turner County | $284 | 3.8% |
| 3 | Seminole County | $274 | 5.0% |
| 4 | Ben Hill County | $273 | 3.9% |
| 5 | Baker County | $271 | 3.9% |
| 6 | Lee County | $270 | 2.6% |
| 7 | Berrien County | $269 | 4.0% |
| 8 | Decatur County | $266 | 2.6% |
| 9 | Atkinson County | $265 | 7.7% |
| 10 | Early County | $261 | 7.4% |
| 11 | Mitchell County | $260 | 2.9% |
| 12 | Miller County | $259 | 3.1% |
| 13 | Tift County | $256 | 2.4% |
| 14 | Colquitt County | $255 | 1.8% |
| 15 | Thomas County | $252 | 4.6% |
| 16 | Worth County | $251 | 3.4% |
| 17 | Cook County | $243 | 3.2% |
| 18 | Toombs County | $242 | 9.5% |
| 19 | Terrell County | $234 | 4.3% |
| 20 | Coffee County | $231 | 5.1% |
| 21 | Calhoun County | $225 | 3.0% |
| 22 | Jeff Davis County | $224 | 4.7% |
| 23 | Brooks County | $223 | 4.3% |
| 24 | Twiggs County | $221 | 2.4% |
| 25 | Irwin County | $220 | 2.9% |
| 25 | Tattnall County | $220 | 6.5% |
| 27 | Pulaski County | $216 | 4.6% |
| 28 | Dodge County | $212 | 2.3% |
| 29 | Randolph County | $207 | 1.8% |
| 30 | Wilcox County | $205 | 3.5% |
| 31 | Jefferson County | $203 | 16.3% |
| 32 | Bacon County | $200 | 9.8% |
| 33 | Bleckley County | $197 | 2.9% |
| 34 | Macon County | $196 | 6.9% |
| 35 | Bulloch County | $194 | 4.5% |
| 36 | Laurens County | $187 | 14.2% |
| 37 | Screven County | $183 | 3.8% |
| 38 | Burke County | $182 | 8.1% |
| 39 | Stewart County | $152 | 9.4% |
What this measures
NASS asks farm operators what they pay in cash rent per acre, separately for irrigated cropland, non-irrigated cropland and pasture. State figures come out at the end of July; county figures follow in August. When too few farms in a county answer, NASS combines that county with others and publishes one "other counties" figure, so some counties have no figure of their own.