Cash rent for irrigated cropland: Pulaski County, Indiana
The average cash rent farmers paid per acre for irrigated cropland, from USDA's yearly cash rents survey.
The latest figures and how they have changed
 Chart by TallyTill · tallytill.com
What the numbers say
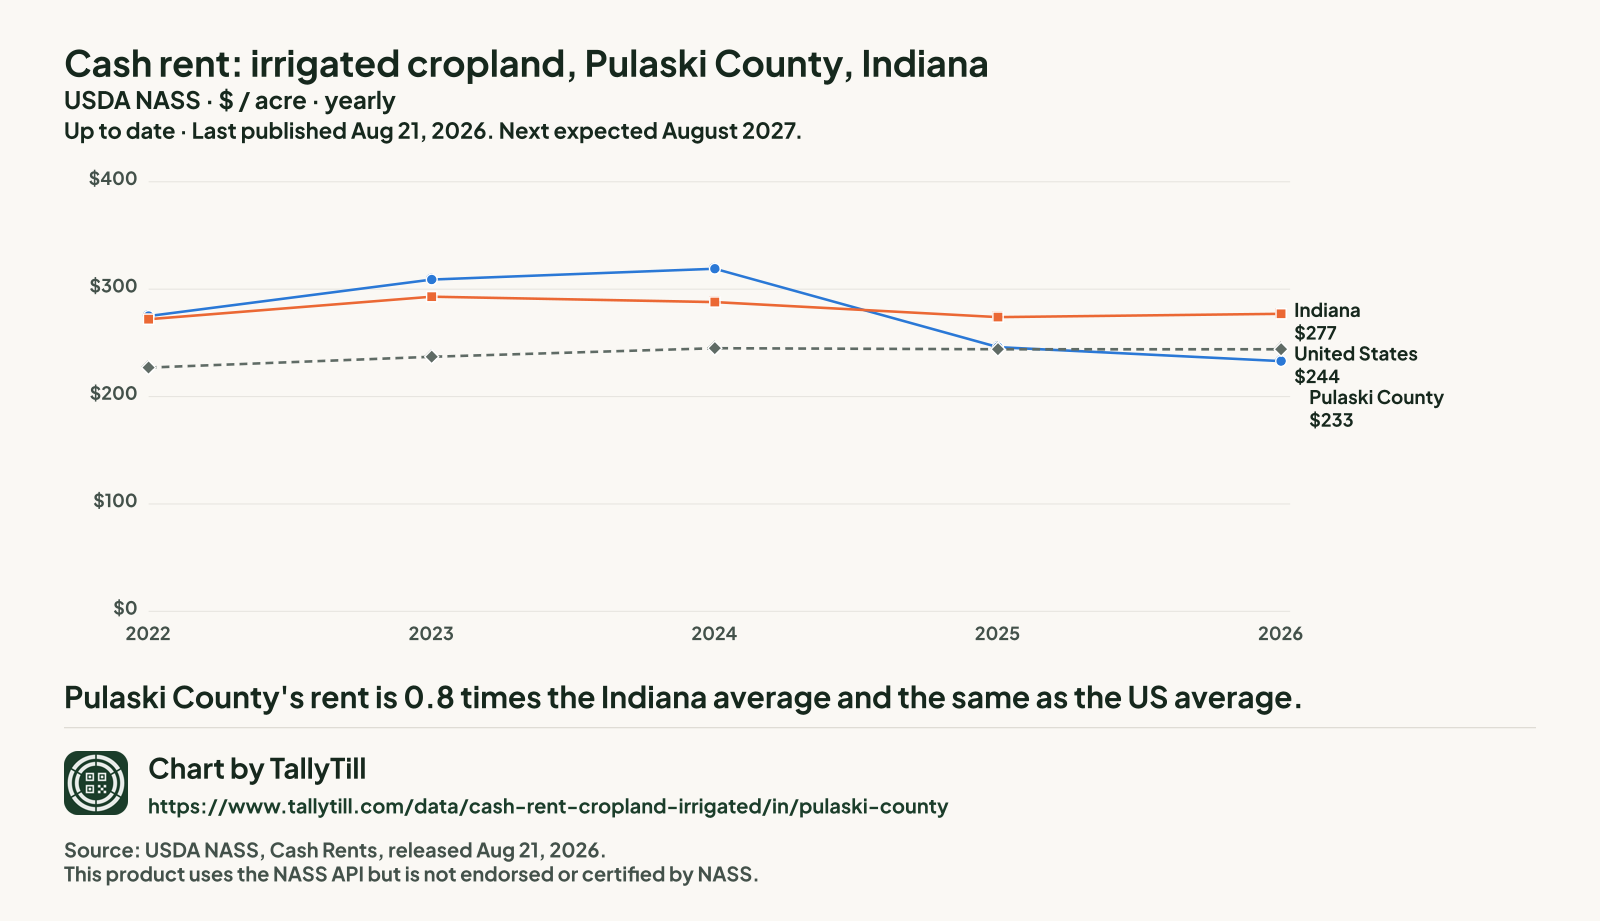
- Pulaski County's rent is 0.8 times the Indiana average and the same as the US average.
- It is tied for the 3rd lowest of the 14 Indiana counties NASS published for 2026.
- Since 2022 it has fallen 15.3%, from $275 to $233 an acre.
Every figure behind this chart
| Year | Pulaski County | Indiana | United States |
|---|---|---|---|
| 2026 | $233 | $277 | $244 |
| 2025 | $246 | $274 | $244 |
| 2024 | $319 | $288 | $245 |
| 2023 | $309 | $293 | $237 |
| 2022 | $275 | $272 | $227 |
Every Indiana county, 2026
Darker shading means a higher figure. Values run from $200 an acre in Jackson County to $312 an acre in St. Joseph County.
- Under $233 (2 counties)
- $233 to under $258 (3 counties)
- $258 to under $285 (3 counties)
- $285 to under $306 (3 counties)
- $306 and over (3 counties)
- Not published separately (78 counties, $277 an acre combined)
NASS combined Adams County, Allen County, Benton County, Blackford County, Boone County, Brown County, Carroll County, Cass County, Clark County, Clay County, Clinton County, Crawford County, Dearborn County, Decatur County, DeKalb County, Delaware County, Dubois County, Fayette County, Floyd County, Fountain County, Franklin County, Gibson County, Grant County, Greene County, Hamilton County, Hancock County, Harrison County, Hendricks County, Henry County, Howard County, Huntington County, Jay County, Jefferson County, Jennings County, Johnson County, Kosciusko County, Lake County, Lawrence County, Madison County, Marion County, Martin County, Miami County, Monroe County, Montgomery County, Morgan County, Newton County, Ohio County, Orange County, Owen County, Parke County, Perry County, Pike County, Posey County, Putnam County, Randolph County, Ripley County, Rush County, Scott County, Shelby County, Spencer County, Starke County, Steuben County, Sullivan County, Switzerland County, Tippecanoe County, Tipton County, Union County, Vanderburgh County, Vermillion County, Vigo County, Wabash County, Warren County, Warrick County, Washington County, Wayne County, Wells County, White County and Whitley County into "other counties", so they have no figure of their own.
| Rank | County | Figure (dollars an acre) | Precision (CV) |
|---|---|---|---|
| 1 | St. Joseph County | $312 | 7.6% |
| 2 | Elkhart County | $307 | 4.9% |
| 3 | Porter County | $306 | 2.6% |
| 4 | Fulton County | $302 | 6.8% |
| 5 | La Porte County | $290 | 3.4% |
| 6 | Daviess County | $285 | 4.6% |
| 7 | Jasper County | $277 | 8.8% |
| 8 | LaGrange County | $274 | 6.3% |
| 9 | Bartholomew County | $258 | 4.5% |
| 10 | Knox County | $239 | 4.0% |
| 11 | Noble County | $233 | 4.9% |
| 11 | Pulaski County This county | $233 | 5.4% |
| 13 | Marshall County | $210 | 8.0% |
| 14 | Jackson County | $200 | 5.5% |
What this measures
NASS asks farm operators what they pay in cash rent per acre, separately for irrigated cropland, non-irrigated cropland and pasture. State figures come out at the end of July; county figures follow in August. When too few farms in a county answer, NASS combines that county with others and publishes one "other counties" figure, so some counties have no figure of their own.