Cash rent for irrigated cropland: Grant County, Kansas
The average cash rent farmers paid per acre for irrigated cropland, from USDA's yearly cash rents survey.
The latest figures and how they have changed
 Chart by TallyTill · tallytill.com
What the numbers say
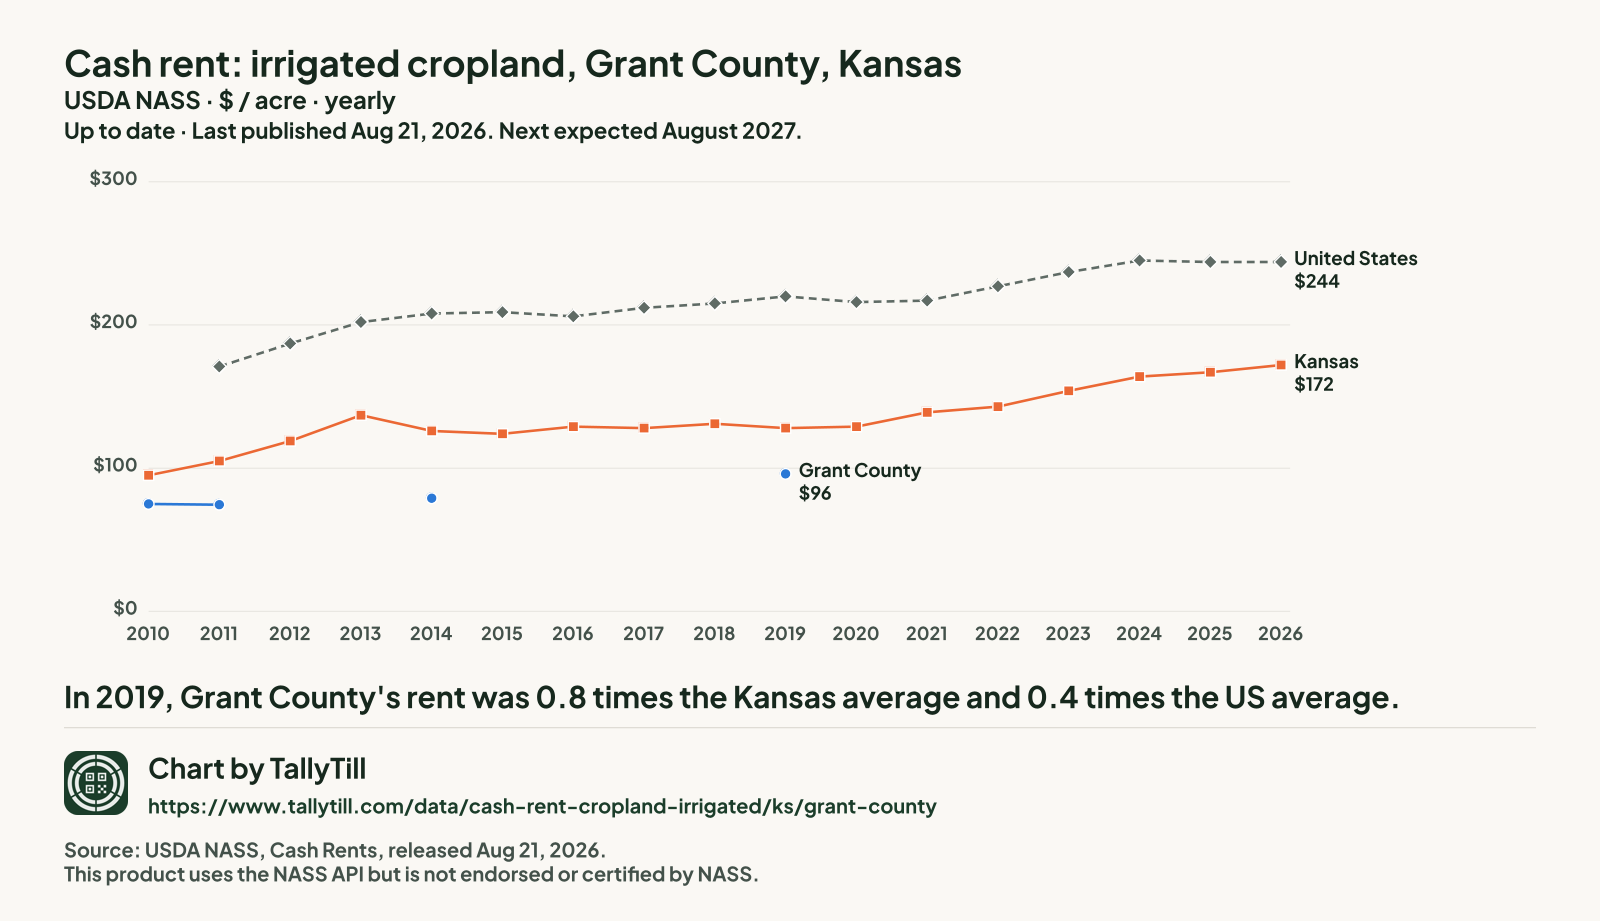
- In 2019, Grant County's rent was 0.8 times the Kansas average and 0.4 times the US average.
- It is tied for the 5th lowest of the 35 Kansas counties NASS published for 2019.
- From 2010 to 2019 it rose 28.0%, from $75 to $96 an acre.
- Gaps are years with no separate Grant figure: NASS ran no county survey in 2015 or 2018, and in 2012, 2013, 2016, 2017, 2020, 2021, 2022, 2023, 2024, 2025 and 2026 it combined Grant into "other counties". Nothing is filled in.
Every figure behind this chart
| Year | Grant County | Kansas | United States |
|---|---|---|---|
| 2026 | Combined into "other counties" | $172 | $244 |
| 2025 | Combined into "other counties" | $167 | $244 |
| 2024 | Combined into "other counties" | $164 | $245 |
| 2023 | Combined into "other counties" | $154 | $237 |
| 2022 | Combined into "other counties" | $143 | $227 |
| 2021 | Combined into "other counties" | $139 | $217 |
| 2020 | Combined into "other counties" | $129 | $216 |
| 2019 | $96 | $128 | $220 |
| 2018 | No county survey that year | $131 | $215 |
| 2017 | Combined into "other counties" | $128 | $212 |
| 2016 | Combined into "other counties" | $129 | $206 |
| 2015 | No county survey that year | $124 | $209 |
| 2014 | $79 | $126 | $208 |
| 2013 | Combined into "other counties" | $137 | $202 |
| 2012 | Combined into "other counties" | $119 | $187 |
| 2011 | $74.50 | $105 | $171 |
| 2010 | $75 | $95 | No figure |
Every Kansas county, 2026
Darker shading means a higher figure. Values run from $101 an acre in Stanton County to $237 an acre in Republic County.
- Under $131 (5 counties)
- $131 to under $151 (6 counties)
- $151 to under $169 (5 counties)
- $169 to under $199 (6 counties)
- $199 and over (6 counties)
- Not published separately (77 counties, $153 an acre combined)
NASS combined Allen County, Anderson County, Atchison County, Barber County, Bourbon County, Brown County, Butler County, Chase County, Chautauqua County, Cherokee County, Clark County, Clay County, Coffey County, Comanche County, Cowley County, Crawford County, Decatur County, Dickinson County, Doniphan County, Douglas County, Elk County, Ellis County, Ellsworth County, Franklin County, Geary County, Gove County, Grant County, Greeley County, Greenwood County, Hamilton County, Harper County, Harvey County, Hodgeman County, Jackson County, Jefferson County, Jewell County, Johnson County, Kingman County, Kiowa County, Labette County, Lane County, Leavenworth County, Lincoln County, Linn County, Lyon County, Marshall County, Meade County, Miami County, Montgomery County, Morris County, Morton County, Nemaha County, Neosho County, Ness County, Norton County, Osage County, Osborne County, Ottawa County, Pawnee County, Phillips County, Pottawatomie County, Rawlins County, Riley County, Rooks County, Rush County, Russell County, Saline County, Smith County, Sumner County, Trego County, Wabaunsee County, Wallace County, Washington County, Wichita County, Wilson County, Woodson County and Wyandotte County into "other counties", so they have no figure of their own.
Grant: not published separately.
| Rank | County | Figure (dollars an acre) | Precision (CV) |
|---|---|---|---|
| 1 | Republic County | $237 | 4.0% |
| 2 | Cloud County | $236 | 9.9% |
| 3 | Finney County | $210 | 4.0% |
| 4 | Kearny County | $204 | 13.3% |
| 5 | Shawnee County | $201 | 6.0% |
| 6 | Sheridan County | $199 | 4.5% |
| 7 | Sherman County | $193 | 3.3% |
| 8 | Thomas County | $189 | 4.4% |
| 9 | Reno County | $181 | 4.1% |
| 10 | Cheyenne County | $170 | 5.5% |
| 11 | Ford County | $169 | 14.0% |
| 11 | Sedgwick County | $169 | 5.5% |
| 13 | Edwards County | $167 | 5.7% |
| 14 | Rice County | $164 | 7.0% |
| 15 | Gray County | $154 | 6.0% |
| 16 | McPherson County | $152 | 9.4% |
| 17 | Stafford County | $151 | 3.7% |
| 18 | Pratt County | $150 | 7.4% |
| 19 | Mitchell County | $148 | 3.9% |
| 20 | Haskell County | $145 | 5.4% |
| 21 | Seward County | $137 | 7.3% |
| 22 | Barton County | $135 | 2.8% |
| 23 | Stevens County | $131 | 7.4% |
| 24 | Logan County | $130 | 5.0% |
| 25 | Scott County | $115 | 8.8% |
| 26 | Graham County | $110 | 7.5% |
| 27 | Marion County | $102 | 8.3% |
| 28 | Stanton County | $101 | 2.7% |
What this measures
NASS asks farm operators what they pay in cash rent per acre, separately for irrigated cropland, non-irrigated cropland and pasture. State figures come out at the end of July; county figures follow in August. When too few farms in a county answer, NASS combines that county with others and publishes one "other counties" figure, so some counties have no figure of their own.