Cash rent for irrigated cropland: Montcalm County, Michigan
The average cash rent farmers paid per acre for irrigated cropland, from USDA's yearly cash rents survey.
The latest figures and how they have changed
 Chart by TallyTill · tallytill.com
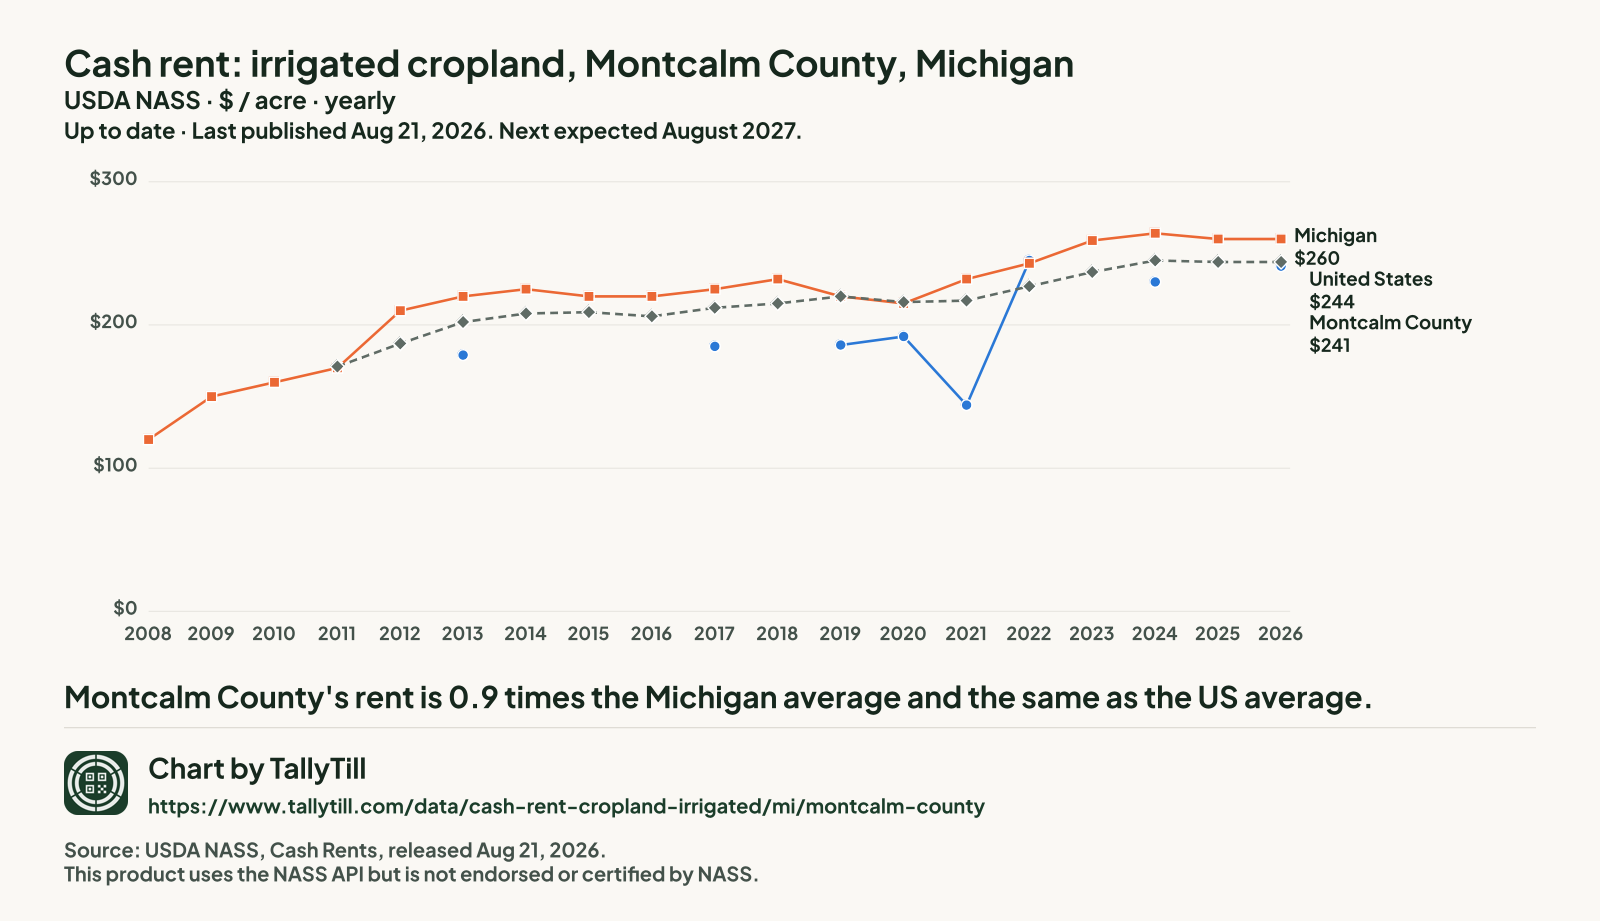
What the numbers say
- Montcalm County's rent is 0.9 times the Michigan average and the same as the US average.
- It is the 9th highest of the 18 Michigan counties NASS published for 2026.
- Since 2013 it has risen 34.6%, from $179 to $241 an acre.
- Gaps are years with no separate Montcalm figure: NASS ran no county survey in 2015 or 2018, in 2009, 2010, 2011, 2012, 2014, 2016, 2023 and 2025 it combined Montcalm into "other counties", and NASS had no figure available in 2008. Nothing is filled in.
Every figure behind this chart
| Year | Montcalm County | Michigan | United States |
|---|---|---|---|
| 2026 | $241 | $260 | $244 |
| 2025 | Combined into "other counties" | $260 | $244 |
| 2024 | $230 | $264 | $245 |
| 2023 | Combined into "other counties" | $259 | $237 |
| 2022 | $245 | $243 | $227 |
| 2021 | $144 | $232 | $217 |
| 2020 | $192 | $215 | $216 |
| 2019 | $186 | $220 | $220 |
| 2018 | No county survey that year | $232 | $215 |
| 2017 | $185 | $225 | $212 |
| 2016 | Combined into "other counties" | $220 | $206 |
| 2015 | No county survey that year | $220 | $209 |
| 2014 | Combined into "other counties" | $225 | $208 |
| 2013 | $179 | $220 | $202 |
| 2012 | Combined into "other counties" | $210 | $187 |
| 2011 | Combined into "other counties" | $170 | $171 |
| 2010 | Combined into "other counties" | $160 | No figure |
| 2009 | Combined into "other counties" | $150 | No figure |
| 2008 | Not available | $120 | No figure |
Every Michigan county, 2026
Darker shading means a higher figure. Values run from $77.50 an acre in Manistee County to $325 an acre in Bay County.
- Under $155 (3 counties)
- $155 to under $236 (4 counties)
- $236 to under $247 (3 counties)
- $247 to under $280 (4 counties)
- $280 and over (4 counties)
- Not published separately (65 counties, $214 an acre combined)
NASS combined Alcona County, Alger County, Allegan County, Alpena County, Antrim County, Arenac County, Baraga County, Barry County, Benzie County, Calhoun County, Charlevoix County, Cheboygan County, Chippewa County, Clare County, Clinton County, Crawford County, Delta County, Dickinson County, Eaton County, Emmet County, Genesee County, Gladwin County, Gogebic County, Grand Traverse County, Houghton County, Huron County, Ingham County, Iosco County, Iron County, Isabella County, Jackson County, Kalkaska County, Keweenaw County, Lake County, Lapeer County, Lenawee County, Livingston County, Luce County, Mackinac County, Macomb County, Marquette County, Menominee County, Midland County, Missaukee County, Monroe County, Montmorency County, Muskegon County, Oakland County, Oceana County, Ogemaw County, Ontonagon County, Osceola County, Oscoda County, Otsego County, Presque Isle County, Roscommon County, Saginaw County, Sanilac County, Schoolcraft County, Shiawassee County, St. Clair County, Tuscola County, Washtenaw County, Wayne County and Wexford County into "other counties", so they have no figure of their own.
| Rank | County | Figure (dollars an acre) | Precision (CV) |
|---|---|---|---|
| 1 | Bay County | $325 | 13.5% |
| 1 | Kalamazoo County | $325 | 7.9% |
| 3 | St Joseph County | $321 | 4.4% |
| 4 | Cass County | $280 | 5.3% |
| 5 | Gratiot County | $264 | 15.7% |
| 6 | Leelanau County | $252 | 3.3% |
| 7 | Ottawa County | $250 | 14.7% |
| 8 | Kent County | $247 | 38.2% |
| 9 | Montcalm County This county | $241 | 8.2% |
| 10 | Berrien County | $240 | 4.5% |
| 11 | Van Buren County | $236 | 5.8% |
| 12 | Ionia County | $235 | 9.1% |
| 13 | Hillsdale County | $233 | 5.9% |
| 14 | Branch County | $190 | 6.6% |
| 15 | Mecosta County | $155 | 7.8% |
| 16 | Newaygo County | $130 | 5.0% |
| 17 | Mason County | $100 | 5.5% |
| 18 | Manistee County | $77.50 | 7.6% |
What this measures
NASS asks farm operators what they pay in cash rent per acre, separately for irrigated cropland, non-irrigated cropland and pasture. State figures come out at the end of July; county figures follow in August. When too few farms in a county answer, NASS combines that county with others and publishes one "other counties" figure, so some counties have no figure of their own.