Cash rent for irrigated cropland: Shelby County, Missouri
The average cash rent farmers paid per acre for irrigated cropland, from USDA's yearly cash rents survey.
The latest figures and how they have changed
 Chart by TallyTill · tallytill.com
What the numbers say
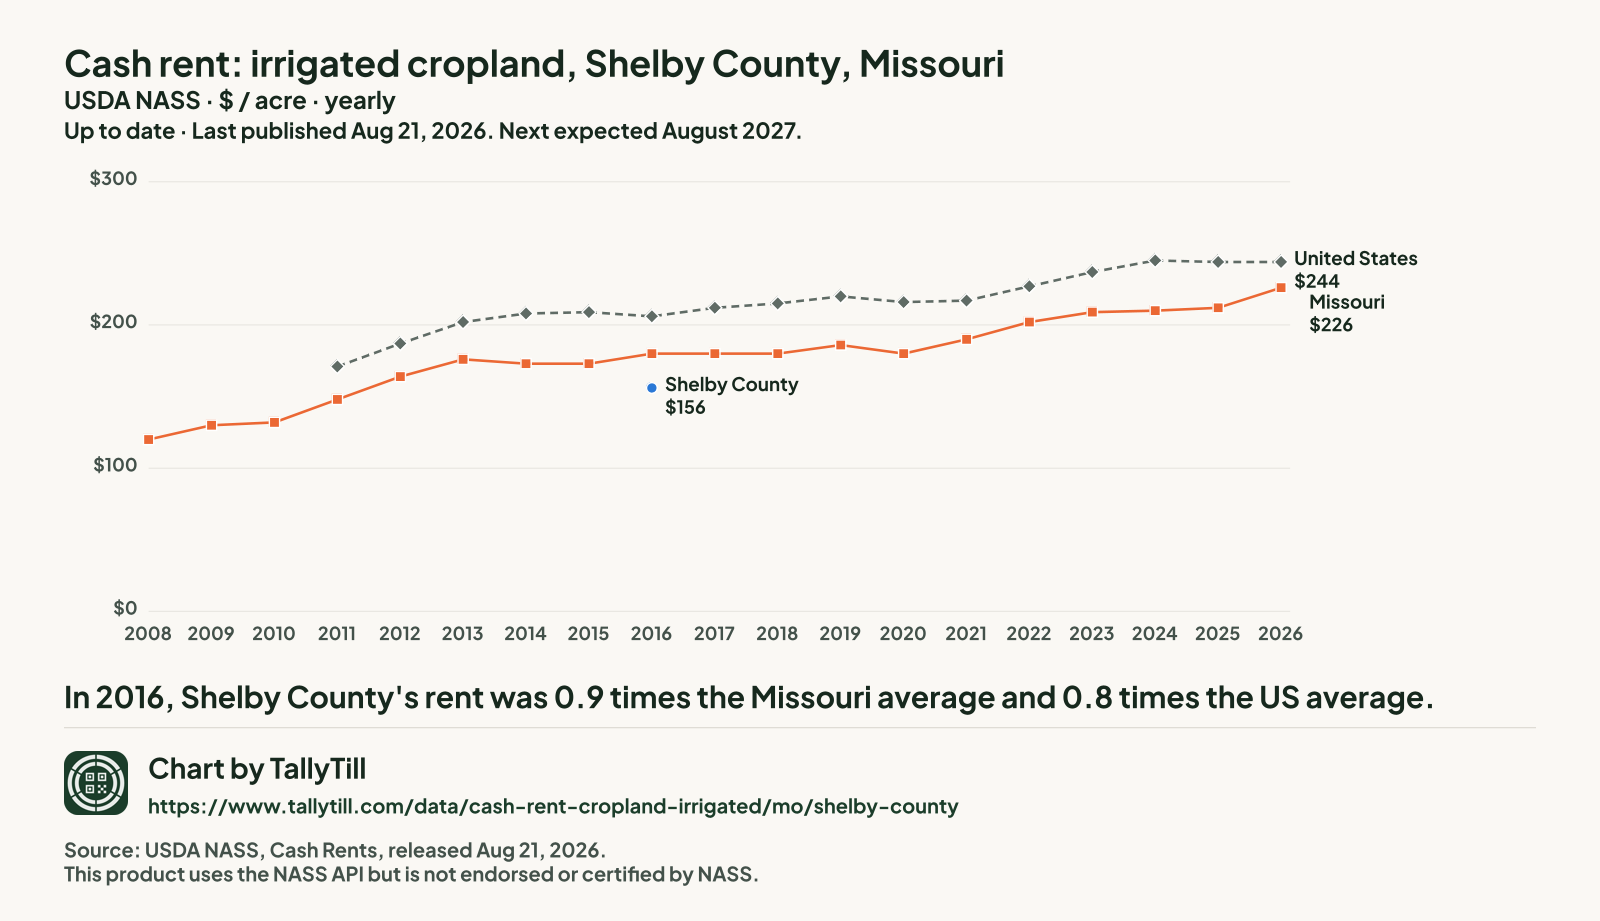
- In 2016, Shelby County's rent was 0.9 times the Missouri average and 0.8 times the US average.
- It is the lowest of the 12 Missouri counties NASS published for 2016.
- Gaps are years with no separate Shelby figure: NASS ran no county survey in 2015 or 2018, in 2009, 2010, 2011, 2012, 2013, 2014, 2017, 2019, 2020, 2021, 2022, 2023, 2024, 2025 and 2026 it combined Shelby into "other counties", and NASS had no figure available in 2008. Nothing is filled in.
Every figure behind this chart
| Year | Shelby County | Missouri | United States |
|---|---|---|---|
| 2026 | Combined into "other counties" | $226 | $244 |
| 2025 | Combined into "other counties" | $212 | $244 |
| 2024 | Combined into "other counties" | $210 | $245 |
| 2023 | Combined into "other counties" | $209 | $237 |
| 2022 | Combined into "other counties" | $202 | $227 |
| 2021 | Combined into "other counties" | $190 | $217 |
| 2020 | Combined into "other counties" | $180 | $216 |
| 2019 | Combined into "other counties" | $186 | $220 |
| 2018 | No county survey that year | $180 | $215 |
| 2017 | Combined into "other counties" | $180 | $212 |
| 2016 | $156 | $180 | $206 |
| 2015 | No county survey that year | $173 | $209 |
| 2014 | Combined into "other counties" | $173 | $208 |
| 2013 | Combined into "other counties" | $176 | $202 |
| 2012 | Combined into "other counties" | $164 | $187 |
| 2011 | Combined into "other counties" | $148 | $171 |
| 2010 | Combined into "other counties" | $132 | No figure |
| 2009 | Combined into "other counties" | $130 | No figure |
| 2008 | Not available | $120 | No figure |
Every Missouri county, 2026
Darker shading means a higher figure. Values run from $185 an acre in Pemiscot County to $260 an acre in Scott County.
- Under $208 (1 county)
- $208 to under $227 (1 county)
- $227 to under $251 (1 county)
- $251 to under $260 (1 county)
- $260 and over (1 county)
- Not published separately (110 counties, $221 an acre combined)
NASS combined Adair County, Andrew County, Atchison County, Audrain County, Barry County, Barton County, Bates County, Benton County, Bollinger County, Boone County, Buchanan County, Butler County, Caldwell County, Callaway County, Camden County, Cape Girardeau County, Carroll County, Carter County, Cass County, Cedar County, Chariton County, Christian County, Clark County, Clay County, Clinton County, Cole County, Cooper County, Crawford County, Dade County, Dallas County, Daviess County, DeKalb County, Dent County, Douglas County, Dunklin County, Franklin County, Gasconade County, Gentry County, Greene County, Grundy County, Harrison County, Henry County, Hickory County, Holt County, Howard County, Howell County, Iron County, Jackson County, Jasper County, Jefferson County, Johnson County, Knox County, Laclede County, Lafayette County, Lawrence County, Lewis County, Lincoln County, Linn County, Livingston County, Macon County, Madison County, Maries County, Marion County, McDonald County, Mercer County, Miller County, Moniteau County, Monroe County, Montgomery County, Morgan County, Newton County, Nodaway County, Oregon County, Osage County, Ozark County, Perry County, Pettis County, Phelps County, Pike County, Platte County, Polk County, Pulaski County, Putnam County, Ralls County, Randolph County, Ray County, Reynolds County, Ripley County, Saline County, Schuyler County, Scotland County, Shannon County, Shelby County, St. Charles County, St. Clair County, St. Francois County, St. Louis city, St. Louis County, Ste. Genevieve County, Stone County, Sullivan County, Taney County, Texas County, Vernon County, Warren County, Washington County, Wayne County, Webster County, Worth County and Wright County into "other counties", so they have no figure of their own.
Shelby: not published separately.
| Rank | County | Figure (dollars an acre) | Precision (CV) |
|---|---|---|---|
| 1 | Scott County | $260 | 4.4% |
| 2 | Mississippi County | $251 | 7.4% |
| 3 | New Madrid County | $227 | 5.3% |
| 4 | Stoddard County | $208 | 3.0% |
| 5 | Pemiscot County | $185 | 6.1% |
What this measures
NASS asks farm operators what they pay in cash rent per acre, separately for irrigated cropland, non-irrigated cropland and pasture. State figures come out at the end of July; county figures follow in August. When too few farms in a county answer, NASS combines that county with others and publishes one "other counties" figure, so some counties have no figure of their own.