Farm & food prices · Production and land

Cash rent for irrigated cropland: Leflore County, Mississippi

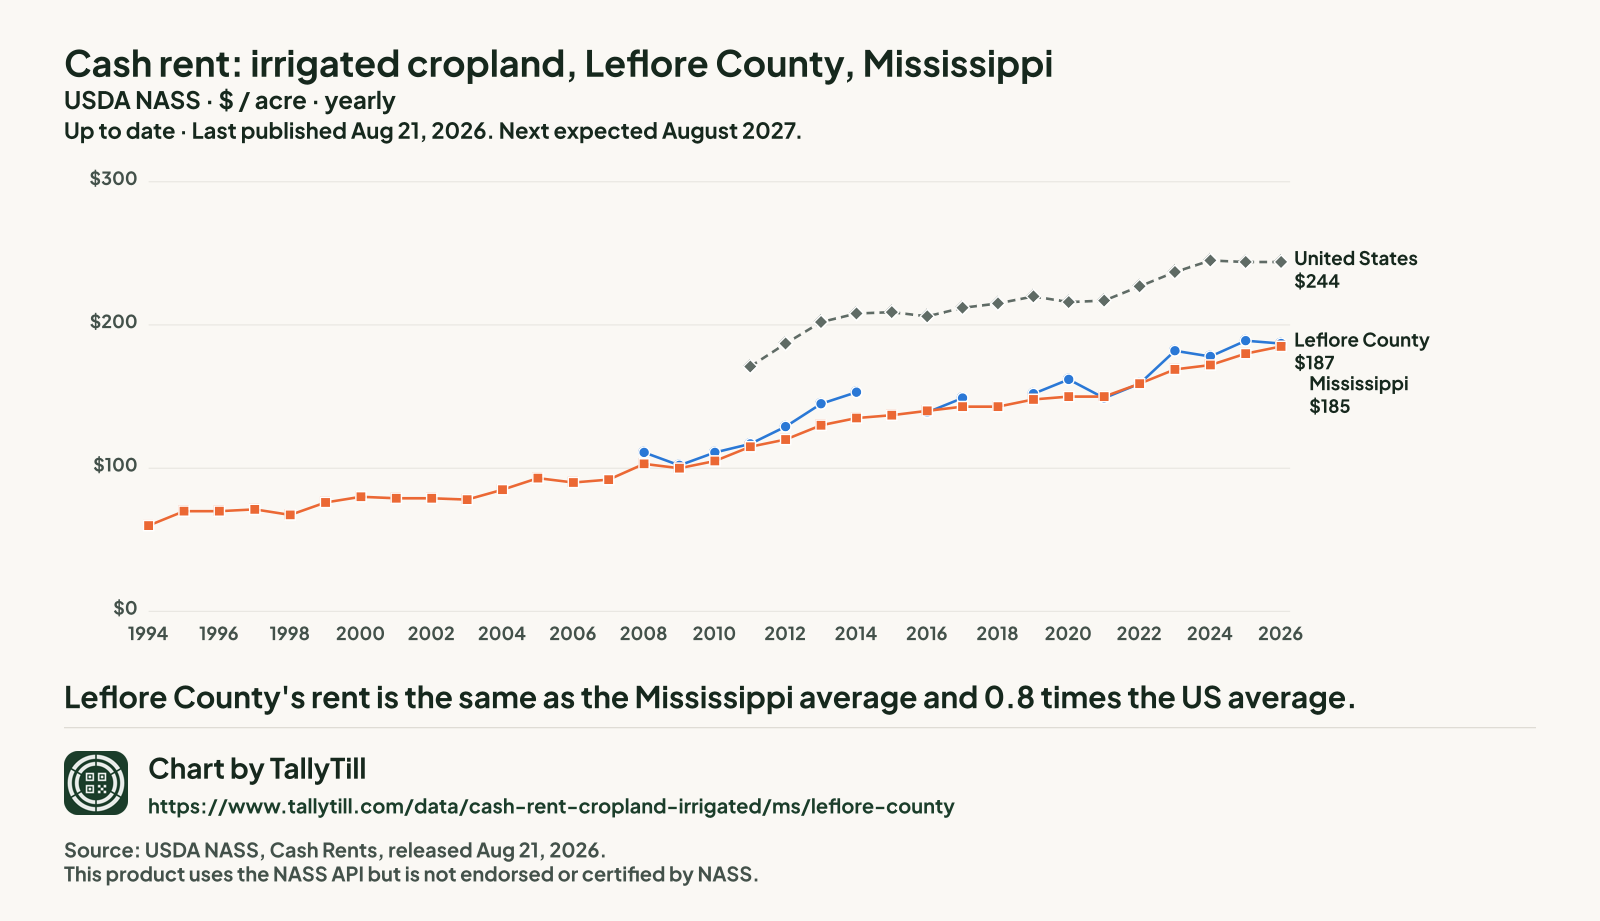
The average cash rent farmers paid per acre for irrigated cropland, from USDA's yearly cash rents survey.

Choose a place Show the figures for the place you chose.
Up to dateYearly. States at the end of July, counties in August. Last published Aug 21, 2026. Next expected August 2027.

The latest figures and how they have changed

Leflore County, 2026
$187 an acre
Down 1.1% from $189 in 2025
Mississippi, 2026
$185 an acre
Up 2.8% from $180 in 2025
United States, 2026
$244 an acre
Unchanged from $244 in 2025
Leflore CountyMississippiUnited States
$0$100$200$30019941996199820002002200420062008201020122014201620182020202220242026Leflore County$187Mississippi$185United States$244

Chart by TallyTill · tallytill.com

View the dataOpen every figure behind this chart in a table.Save imageSave this chart as a picture.

What the numbers say

  • Leflore County's rent is the same as the Mississippi average and 0.8 times the US average.
  • It is the 10th lowest of the 20 Mississippi counties NASS published for 2026.
  • Since 2008 it has risen 68.5%, from $111 to $187 an acre.
  • Gaps are years with no separate Leflore figure: NASS ran no county survey in 2015 or 2018. Nothing is filled in.

Every figure behind this chart

Cash rent: irrigated cropland, dollars an acre
YearLeflore CountyMississippiUnited States
2026$187$185$244
2025$189$180$244
2024$178$172$245
2023$182$169$237
2022$159$159$227
2021$149$150$217
2020$162$150$216
2019$152$148$220
2018No county survey that year$143$215
2017$149$143$212
2016$139$140$206
2015No county survey that year$137$209
2014$153$135$208
2013$145$130$202
2012$129$120$187
2011$117$115$171
2010$111$105No figure
2009$102$100No figure
2008$111$103No figure
2007No figure$92No figure
2006No figure$90No figure
2005No figure$93No figure
2004No figure$85No figure
2003No figure$78No figure
2002No figure$79No figure
2001No figure$79No figure
2000No figure$80No figure
1999No figure$76No figure
1998No figure$67.30No figure
1997No figure$71.20No figure
1996No figure$70No figure
1995No figure$70No figure
1994No figure$59.90No figure
Get a link and a preview picture of this chart to share. Get the code to show this chart on your own website.

Share this chart

FacebookShare this link on Facebook.XShare this link on X.LinkedInShare this link on LinkedIn.RedditShare this link on Reddit.PinterestShare this link on Pinterest.EmailEmail this link.Open the share menu on your device. Copy the link to your clipboard.

Embed this chart on your site

Copy the code to your clipboard.

The chart shows the latest figures TallyTill has collected and updates itself when a new release is collected. Keep the link under it: it credits the source and the explorer.

Every Mississippi county, 2026

Darker shading means a higher figure. Values run from $139 an acre in Marshall County to $204 an acre in Tallahatchie County.

Adams County: combined into "other counties"Alcorn County: combined into "other counties"Amite County: combined into "other counties"Attala County: combined into "other counties"Benton County: combined into "other counties"Bolivar County: $182 an acreCalhoun County: $146 an acreCarroll County: $197 an acreChickasaw County: $165 an acreChoctaw County: combined into "other counties"Claiborne County: combined into "other counties"Clarke County: combined into "other counties"Clay County: combined into "other counties"Coahoma County: $193 an acreCopiah County: combined into "other counties"Covington County: combined into "other counties"DeSoto County: combined into "other counties"Forrest County: combined into "other counties"Franklin County: combined into "other counties"George County: combined into "other counties"Greene County: combined into "other counties"Grenada County: combined into "other counties"Hancock County: combined into "other counties"Harrison County: combined into "other counties"Hinds County: combined into "other counties"Holmes County: $197 an acreHumphreys County: $203 an acreIssaquena County: $202 an acreItawamba County: combined into "other counties"Jackson County: combined into "other counties"Jasper County: combined into "other counties"Jefferson County: combined into "other counties"Jefferson Davis County: combined into "other counties"Jones County: combined into "other counties"Kemper County: combined into "other counties"Lafayette County: combined into "other counties"Lamar County: combined into "other counties"Lauderdale County: combined into "other counties"Lawrence County: combined into "other counties"Leake County: combined into "other counties"Lee County: combined into "other counties"Leflore County: $187 an acreLincoln County: combined into "other counties"Lowndes County: combined into "other counties"Madison County: combined into "other counties"Marion County: combined into "other counties"Marshall County: $139 an acreMonroe County: combined into "other counties"Montgomery County: combined into "other counties"Neshoba County: combined into "other counties"Newton County: combined into "other counties"Noxubee County: $194 an acreOktibbeha County: combined into "other counties"Panola County: $184 an acrePearl River County: combined into "other counties"Perry County: combined into "other counties"Pike County: combined into "other counties"Pontotoc County: combined into "other counties"Prentiss County: combined into "other counties"Quitman County: $176 an acreRankin County: combined into "other counties"Scott County: combined into "other counties"Sharkey County: $175 an acreSimpson County: combined into "other counties"Smith County: combined into "other counties"Stone County: combined into "other counties"Sunflower County: $178 an acreTallahatchie County: $204 an acreTate County: combined into "other counties"Tippah County: combined into "other counties"Tishomingo County: combined into "other counties"Tunica County: $157 an acreUnion County: combined into "other counties"Walthall County: combined into "other counties"Warren County: $190 an acreWashington County: $190 an acreWayne County: combined into "other counties"Webster County: combined into "other counties"Wilkinson County: combined into "other counties"Winston County: combined into "other counties"Yalobusha County: combined into "other counties"Yazoo County: $195 an acreLeflore $187Leflore $187
  • Under $175 (4 counties)
  • $175 to under $184 (4 counties)
  • $184 to under $193 (4 counties)
  • $193 to under $197 (3 counties)
  • $197 and over (5 counties)
  • Not published separately (62 counties, $140 an acre combined)

NASS combined Adams County, Alcorn County, Amite County, Attala County, Benton County, Choctaw County, Claiborne County, Clarke County, Clay County, Copiah County, Covington County, DeSoto County, Forrest County, Franklin County, George County, Greene County, Grenada County, Hancock County, Harrison County, Hinds County, Itawamba County, Jackson County, Jasper County, Jefferson County, Jefferson Davis County, Jones County, Kemper County, Lafayette County, Lamar County, Lauderdale County, Lawrence County, Leake County, Lee County, Lincoln County, Lowndes County, Madison County, Marion County, Monroe County, Montgomery County, Neshoba County, Newton County, Oktibbeha County, Pearl River County, Perry County, Pike County, Pontotoc County, Prentiss County, Rankin County, Scott County, Simpson County, Smith County, Stone County, Tate County, Tippah County, Tishomingo County, Union County, Walthall County, Wayne County, Webster County, Wilkinson County, Winston County and Yalobusha County into "other counties", so they have no figure of their own.

Published Mississippi counties, highest first, 2026
Rank County Figure (dollars an acre) Precision (CV)
1 Tallahatchie County $204 3.1%
2 Humphreys County $203 4.3%
3 Issaquena County $202 4.6%
4 Carroll County $197 5.4%
4 Holmes County $197 3.1%
6 Yazoo County $195 2.8%
7 Noxubee County $194 4.3%
8 Coahoma County $193 1.7%
9 Warren County $190 1.6%
9 Washington County $190 3.2%
11 Leflore County This county $187 2.0%
12 Panola County $184 4.8%
13 Bolivar County $182 1.2%
14 Sunflower County $178 2.4%
15 Quitman County $176 5.0%
16 Sharkey County $175 3.1%
17 Chickasaw County $165 4.1%
18 Tunica County $157 4.0%
19 Calhoun County $146 5.0%
20 Marshall County $139 6.3%
Source: USDA National Agricultural Statistics Service (NASS), Cash Rents Survey. County estimates released Aug 21, 2026; state and US estimates released Jul 31, 2026. Quick Stats item "RENT, CASH, CROPLAND, IRRIGATED - EXPENSE, MEASURED IN $ / ACRE". Retrieved Oct 20, 2026; snapshot 2026-10-20.1. Precision: NASS's coefficient of variation for Leflore is 2.0% (lower means more precise). Dollars as published, not adjusted for inflation. This product uses the NASS API but is not endorsed or certified by NASS.

What this measures

NASS asks farm operators what they pay in cash rent per acre, separately for irrigated cropland, non-irrigated cropland and pasture. State figures come out at the end of July; county figures follow in August. When too few farms in a county answer, NASS combines that county with others and publishes one "other counties" figure, so some counties have no figure of their own.

Close this window.
Close this window.
Reconnecting…
One moment — we're restoring your session.