Farm & food prices · Production and land

Cash rent for irrigated cropland: Yellowstone County, Montana

The average cash rent farmers paid per acre for irrigated cropland, from USDA's yearly cash rents survey.

Choose a place Show the figures for the place you chose.
Up to dateYearly. States at the end of July, counties in August. Last published Aug 21, 2026. Next expected August 2027.

The latest figures and how they have changed

Yellowstone County, 2026
$132 an acre
Up 10.0% from $120 in 2025
Montana, 2026
$112 an acre
Up 7.7% from $104 in 2025
United States, 2026
$244 an acre
Unchanged from $244 in 2025
Yellowstone CountyMontanaUnited States
$0$100$200$3002017201820192020202120222023202420252026Yellowstone County$132Montana$112United States$244

Chart by TallyTill · tallytill.com

View the dataOpen every figure behind this chart in a table.Save imageSave this chart as a picture.

What the numbers say

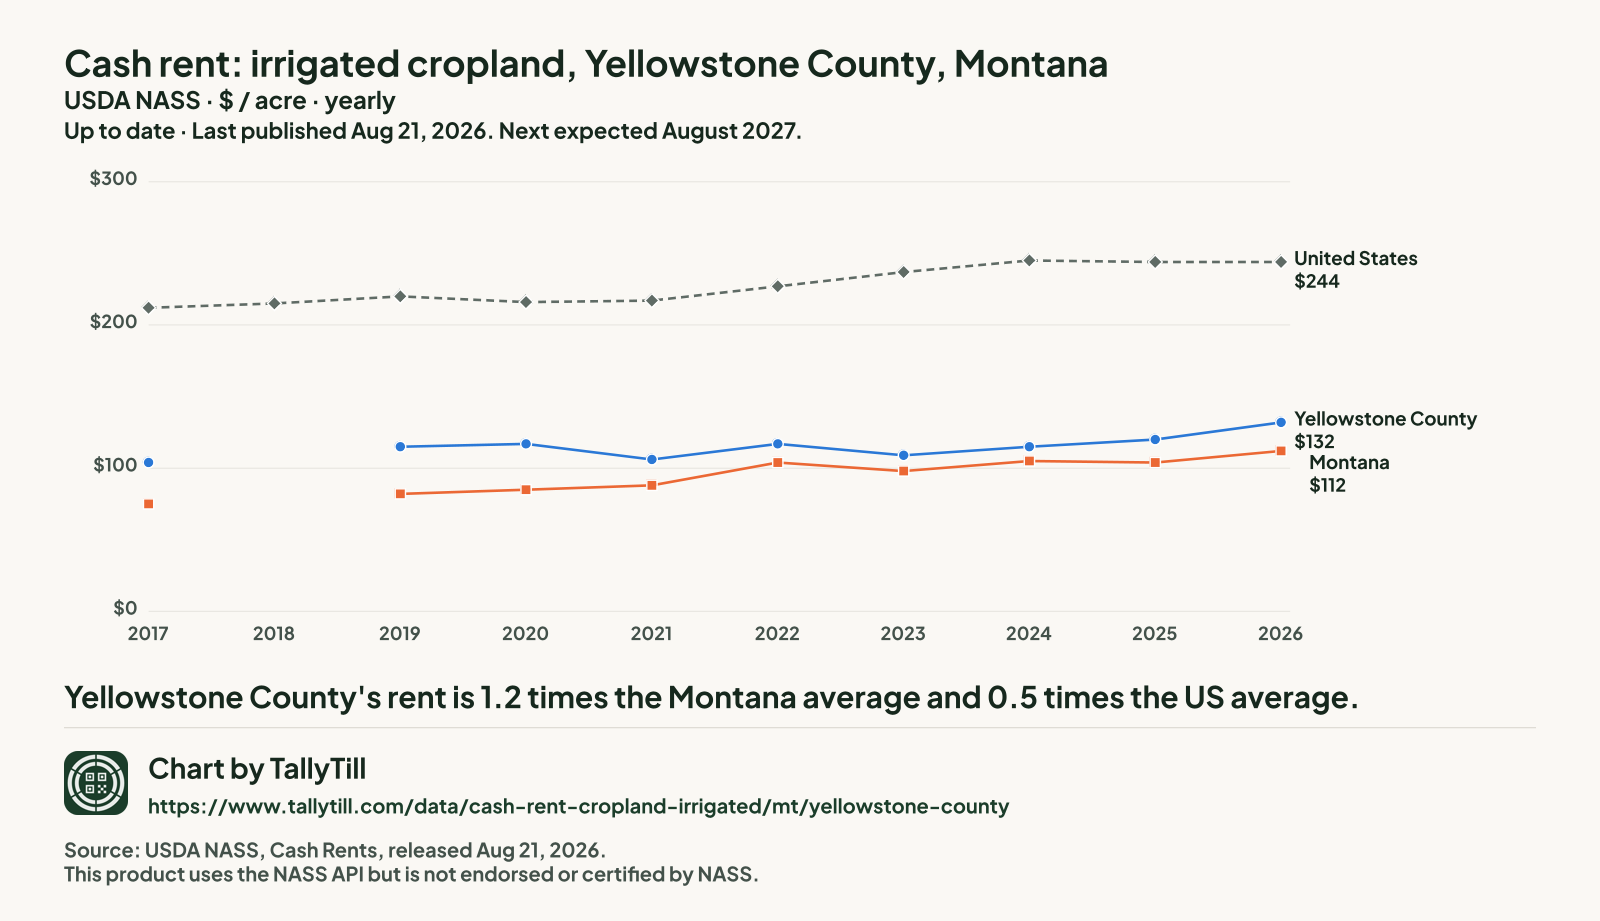
  • Yellowstone County's rent is 1.2 times the Montana average and 0.5 times the US average.
  • It is the 5th highest of the 29 Montana counties NASS published for 2026.
  • Since 2017 it has risen 26.9%, from $104 to $132 an acre.
  • Gaps are years with no separate Yellowstone figure: NASS ran no county survey in 2018. Nothing is filled in.

Every figure behind this chart

Cash rent: irrigated cropland, dollars an acre
YearYellowstone CountyMontanaUnited States
2026$132$112$244
2025$120$104$244
2024$115$105$245
2023$109$98$237
2022$117$104$227
2021$106$88$217
2020$117$85$216
2019$115$82$220
2018No county survey that yearNo figure$215
2017$104$75$212
Get a link and a preview picture of this chart to share. Get the code to show this chart on your own website.

Share this chart

FacebookShare this link on Facebook.XShare this link on X.LinkedInShare this link on LinkedIn.RedditShare this link on Reddit.PinterestShare this link on Pinterest.EmailEmail this link.Open the share menu on your device. Copy the link to your clipboard.

Embed this chart on your site

Copy the code to your clipboard.

The chart shows the latest figures TallyTill has collected and updates itself when a new release is collected. Keep the link under it: it credits the source and the explorer.

Every Montana county, 2026

Darker shading means a higher figure. Values run from $58.50 an acre in Silver Bow County to $215 an acre in Broadwater County.

Beaverhead County: $121 an acreBig Horn County: $102 an acreBlaine County: combined into "other counties"Broadwater County: $215 an acreCarbon County: $116 an acreCarter County: combined into "other counties"Cascade County: $99.50 an acreChouteau County: combined into "other counties"Custer County: $103 an acreDaniels County: combined into "other counties"Dawson County: combined into "other counties"Deer Lodge County: combined into "other counties"Fallon County: combined into "other counties"Fergus County: combined into "other counties"Flathead County: $71 an acreGallatin County: $173 an acreGarfield County: combined into "other counties"Glacier County: $73.50 an acreGolden Valley County: combined into "other counties"Granite County: combined into "other counties"Hill County: combined into "other counties"Jefferson County: $97.50 an acreJudith Basin County: combined into "other counties"Lake County: $92.50 an acreLewis and Clark County: $86 an acreLiberty County: $60 an acreLincoln County: combined into "other counties"McCone County: combined into "other counties"Madison County: $127 an acreMeagher County: combined into "other counties"Mineral County: combined into "other counties"Missoula County: combined into "other counties"Musselshell County: combined into "other counties"Park County: $91.50 an acrePetroleum County: combined into "other counties"Phillips County: $66 an acrePondera County: $86 an acrePowder River County: combined into "other counties"Powell County: $80 an acrePrairie County: $153 an acreRavalli County: $87 an acreRichland County: $143 an acreRoosevelt County: combined into "other counties"Rosebud County: combined into "other counties"Sanders County: $62 an acreSheridan County: combined into "other counties"Silver Bow County: $58.50 an acreStillwater County: $103 an acreSweet Grass County: $69.50 an acreTeton County: $108 an acreToole County: combined into "other counties"Treasure County: $131 an acreValley County: $62.50 an acreWheatland County: combined into "other counties"Wibaux County: combined into "other counties"Yellowstone County: $132 an acreYellowstone $132Yellowstone $132
  • Under $69.50 (5 counties)
  • $69.50 to under $87 (6 counties)
  • $87 to under $103 (6 counties)
  • $103 to under $131 (6 counties)
  • $131 and over (6 counties)
  • Not published separately (27 counties, $98 an acre combined)

NASS combined Blaine County, Carter County, Chouteau County, Daniels County, Dawson County, Deer Lodge County, Fallon County, Fergus County, Garfield County, Golden Valley County, Granite County, Hill County, Judith Basin County, Lincoln County, McCone County, Meagher County, Mineral County, Missoula County, Musselshell County, Petroleum County, Powder River County, Roosevelt County, Rosebud County, Sheridan County, Toole County, Wheatland County and Wibaux County into "other counties", so they have no figure of their own.

Published Montana counties, highest first, 2026
Rank County Figure (dollars an acre) Precision (CV)
1 Broadwater County $215 8.6%
2 Gallatin County $173 5.2%
3 Prairie County $153 13.7%
4 Richland County $143 6.1%
5 Yellowstone County This county $132 6.6%
6 Treasure County $131 5.4%
7 Madison County $127 9.2%
8 Beaverhead County $121 6.7%
9 Carbon County $116 9.4%
10 Teton County $108 7.6%
11 Custer County $103 6.4%
11 Stillwater County $103 7.4%
13 Big Horn County $102 6.9%
14 Cascade County $99.50 6.6%
15 Jefferson County $97.50 5.9%
16 Lake County $92.50 4.8%
17 Park County $91.50 4.8%
18 Ravalli County $87 47.3%
19 Lewis and Clark County $86 8.0%
19 Pondera County $86 8.2%
21 Powell County $80 22.1%
22 Glacier County $73.50 6.2%
23 Flathead County $71 7.3%
24 Sweet Grass County $69.50 32.6%
25 Phillips County $66 17.0%
26 Valley County $62.50 13.5%
27 Sanders County $62 14.3%
28 Liberty County $60 9.4%
29 Silver Bow County $58.50 12.0%
Source: USDA National Agricultural Statistics Service (NASS), Cash Rents Survey. County estimates released Aug 21, 2026; state and US estimates released Jul 31, 2026. Quick Stats item "RENT, CASH, CROPLAND, IRRIGATED - EXPENSE, MEASURED IN $ / ACRE". Retrieved Oct 20, 2026; snapshot 2026-10-20.1. Precision: NASS's coefficient of variation for Yellowstone is 6.6% (lower means more precise). Dollars as published, not adjusted for inflation. This product uses the NASS API but is not endorsed or certified by NASS.

What this measures

NASS asks farm operators what they pay in cash rent per acre, separately for irrigated cropland, non-irrigated cropland and pasture. State figures come out at the end of July; county figures follow in August. When too few farms in a county answer, NASS combines that county with others and publishes one "other counties" figure, so some counties have no figure of their own.

Close this window.
Close this window.
Reconnecting…
One moment — we're restoring your session.