Cash rent for non-irrigated cropland: Randolph County, Arkansas
The average cash rent farmers paid per acre for non-irrigated cropland, from USDA's yearly cash rents survey.
The latest figures and how they have changed
 Chart by TallyTill · tallytill.com
What the numbers say
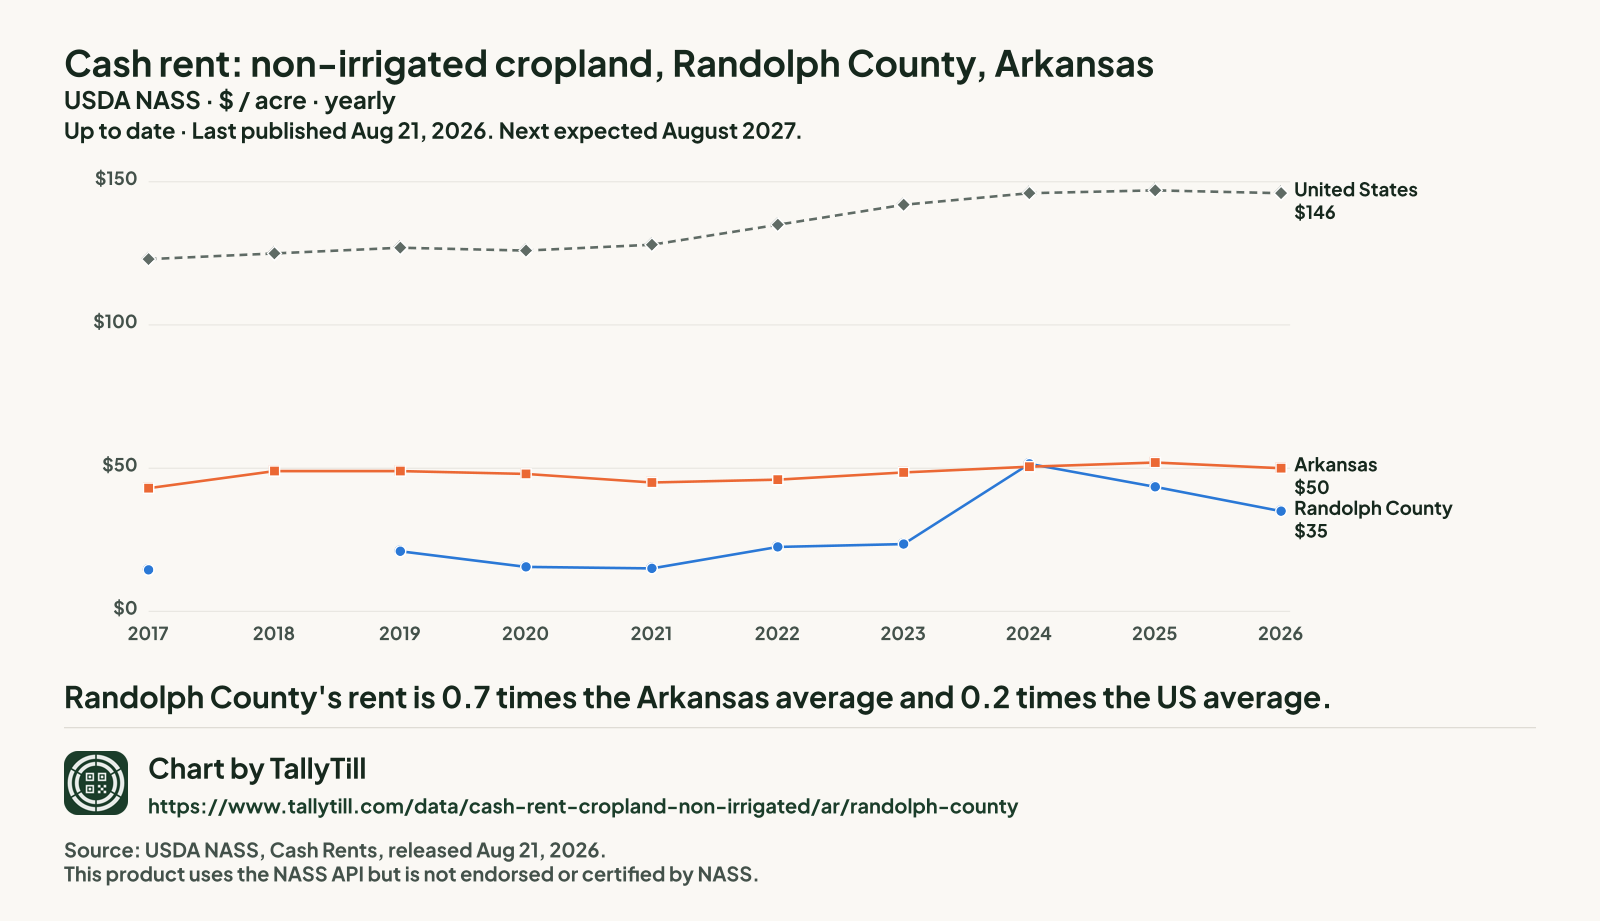
- Randolph County's rent is 0.7 times the Arkansas average and 0.2 times the US average.
- It is tied for the 21st highest of the 61 Arkansas counties NASS published for 2026.
- Since 2017 it has risen 141.4%, from $14.50 to $35 an acre.
- Gaps are years with no separate Randolph figure: NASS ran no county survey in 2018. Nothing is filled in.
Every figure behind this chart
| Year | Randolph County | Arkansas | United States |
|---|---|---|---|
| 2026 | $35 | $50 | $146 |
| 2025 | $43.50 | $52 | $147 |
| 2024 | $51.50 | $50.50 | $146 |
| 2023 | $23.50 | $48.50 | $142 |
| 2022 | $22.50 | $46 | $135 |
| 2021 | $15 | $45 | $128 |
| 2020 | $15.50 | $48 | $126 |
| 2019 | $21 | $49 | $127 |
| 2018 | No county survey that year | $49 | $125 |
| 2017 | $14.50 | $43 | $123 |
Every Arkansas county, 2026
Darker shading means a higher figure. Values run from $13 an acre in Grant County to $169 an acre in Mississippi County.
- Under $40 (46 counties)
- $40 to under $80 (4 counties)
- $80 to under $120 (6 counties)
- $120 to under $160 (4 counties)
- $160 and over (1 county)
- Not published separately (14 counties, $72.50 an acre combined)
NASS combined Arkansas County, Ashley County, Bradley County, Calhoun County, Clay County, Craighead County, Desha County, Garland County, Jackson County, Lafayette County, Lee County, Monroe County, Ouachita County and Union County into "other counties", so they have no figure of their own.
| Rank | County | Figure (dollars an acre) | Precision (CV) |
|---|---|---|---|
| 1 | Mississippi County | $169 | 8.9% |
| 2 | Chicot County | $159 | 11.1% |
| 3 | Cross County | $140 | 13.4% |
| 4 | Saint Francis County | $136 | 15.9% |
| 5 | Woodruff County | $127 | 8.7% |
| 6 | Phillips County | $119 | 6.8% |
| 7 | Poinsett County | $110 | 6.0% |
| 8 | Crittenden County | $109 | 6.6% |
| 9 | Greene County | $105 | 6.1% |
| 10 | Lawrence County | $90 | 3.7% |
| 11 | Jefferson County | $82.50 | 11.9% |
| 12 | Madison County | $53 | 15.2% |
| 12 | Washington County | $53 | 6.5% |
| 14 | Benton County | $52.50 | 6.6% |
| 15 | Carroll County | $50 | 9.3% |
| 16 | Clark County | $39.50 | 17.3% |
| 17 | Drew County | $39 | 21.6% |
| 17 | Pulaski County | $39 | 31.6% |
| 19 | Pike County | $38 | 11.8% |
| 20 | Boone County | $35.50 | 10.7% |
| 21 | Randolph County This county | $35 | 7.5% |
| 21 | Sebastian County | $35 | 8.1% |
| 23 | Logan County | $33 | 9.8% |
| 24 | Fulton County | $32 | 15.4% |
| 24 | Howard County | $32 | 11.1% |
| 24 | Miller County | $32 | 20.6% |
| 27 | Crawford County | $31 | 6.5% |
| 27 | Polk County | $31 | 8.6% |
| 29 | White County | $30.50 | 20.5% |
| 30 | Hempstead County | $30 | 7.0% |
| 30 | Lonoke County | $30 | 6.2% |
| 30 | Marion County | $30 | 12.3% |
| 30 | Stone County | $30 | 13.6% |
| 34 | Independence County | $28.50 | 10.1% |
| 34 | Montgomery County | $28.50 | 6.6% |
| 36 | Izard County | $28 | 10.3% |
| 36 | Little River County | $28 | 9.5% |
| 38 | Perry County | $27 | 10.4% |
| 39 | Franklin County | $26.50 | 17.9% |
| 40 | Faulkner County | $26 | 6.0% |
| 40 | Prairie County | $26 | 4.2% |
| 40 | Yell County | $26 | 36.0% |
| 43 | Baxter County | $25.50 | 9.3% |
| 43 | Hot Spring County | $25.50 | 12.3% |
| 43 | Newton County | $25.50 | 15.1% |
| 46 | Lincoln County | $25 | 7.7% |
| 46 | Sharp County | $25 | 6.5% |
| 48 | Cleveland County | $24.50 | 8.1% |
| 48 | Conway County | $24.50 | 6.7% |
| 50 | Sevier County | $24 | 6.6% |
| 51 | Johnson County | $23.50 | 7.3% |
| 52 | Cleburne County | $23 | 6.3% |
| 52 | Scott County | $23 | 7.5% |
| 54 | Van Buren County | $21 | 6.4% |
| 55 | Nevada County | $19 | 6.3% |
| 55 | Pope County | $19 | 7.1% |
| 55 | Searcy County | $19 | 7.8% |
| 58 | Columbia County | $17 | 9.9% |
| 58 | Saline County | $17 | 12.1% |
| 60 | Dallas County | $13.50 | 8.3% |
| 61 | Grant County | $13 | 8.4% |
What this measures
NASS asks farm operators what they pay in cash rent per acre, separately for irrigated cropland, non-irrigated cropland and pasture. State figures come out at the end of July; county figures follow in August. When too few farms in a county answer, NASS combines that county with others and publishes one "other counties" figure, so some counties have no figure of their own.