Cash rent for non-irrigated cropland: Gilchrist County, Florida
The average cash rent farmers paid per acre for non-irrigated cropland, from USDA's yearly cash rents survey.
The latest figures and how they have changed
 Chart by TallyTill · tallytill.com
What the numbers say
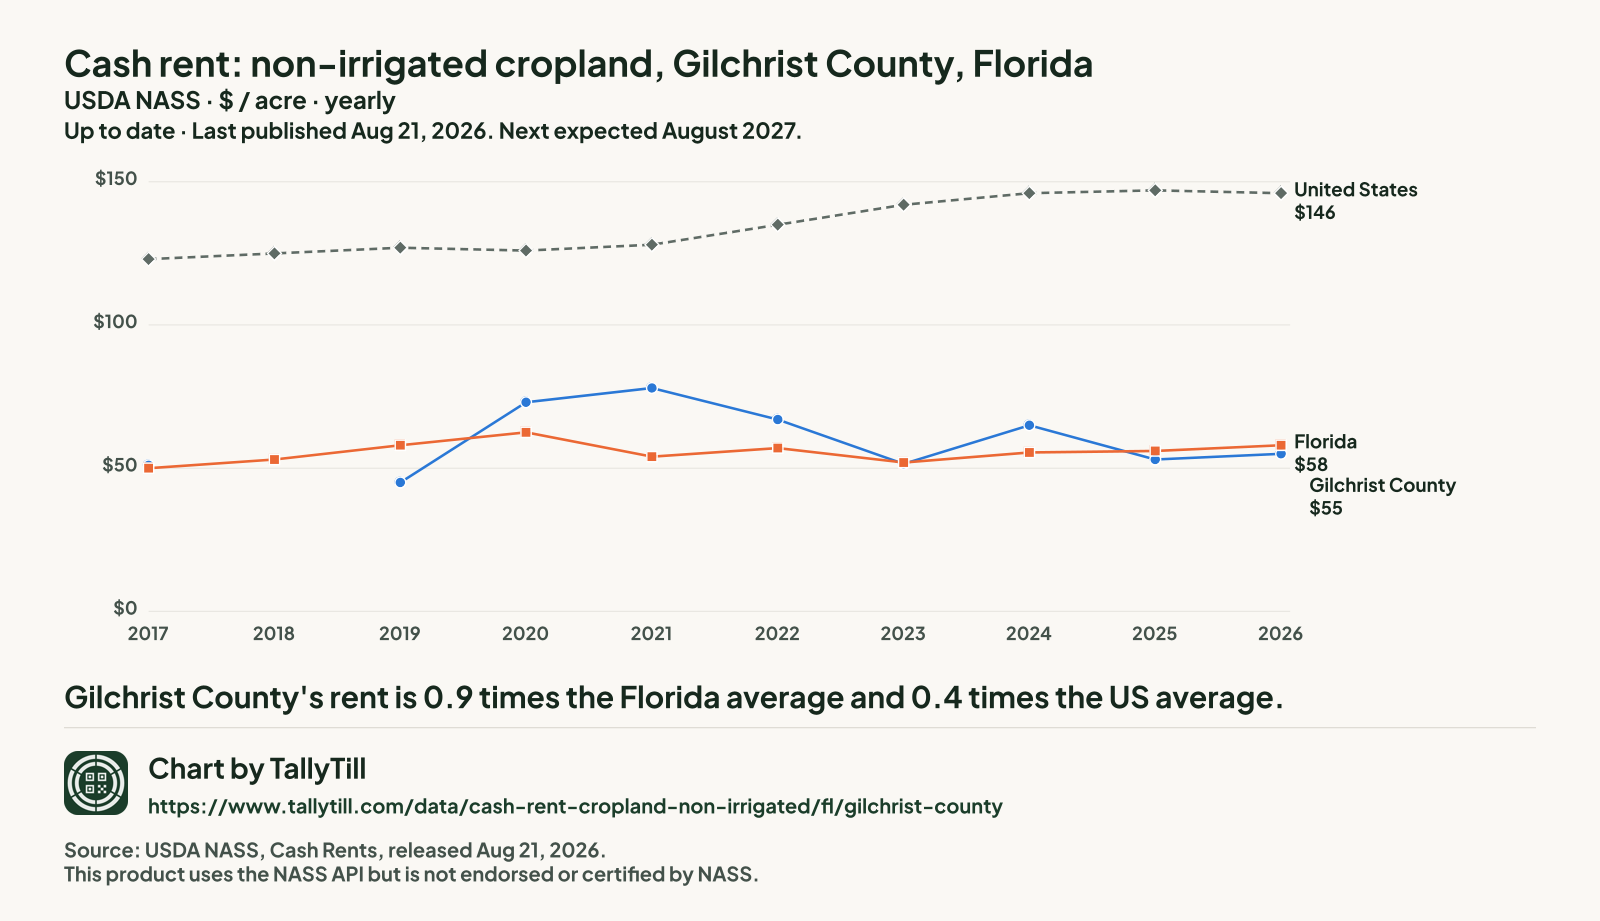
- Gilchrist County's rent is 0.9 times the Florida average and 0.4 times the US average.
- It is the 6th highest of the 21 Florida counties NASS published for 2026.
- Since 2017 it has risen 7.8%, from $51 to $55 an acre.
- Gaps are years with no separate Gilchrist figure: NASS ran no county survey in 2018. Nothing is filled in.
Every figure behind this chart
| Year | Gilchrist County | Florida | United States |
|---|---|---|---|
| 2026 | $55 | $58 | $146 |
| 2025 | $53 | $56 | $147 |
| 2024 | $65 | $55.50 | $146 |
| 2023 | $51.50 | $52 | $142 |
| 2022 | $67 | $57 | $135 |
| 2021 | $78 | $54 | $128 |
| 2020 | $73 | $62.50 | $126 |
| 2019 | $45 | $58 | $127 |
| 2018 | No county survey that year | $53 | $125 |
| 2017 | $51 | $50 | $123 |
Every Florida county, 2026
Darker shading means a higher figure. Values run from $22 an acre in Madison County to $107 an acre in Santa Rosa County.
- Under $40 (4 counties)
- $40 to under $80 (15 counties)
- $80 to under $120 (2 counties)
- $120 to under $160 (0 counties)
- $160 and over (0 counties)
- Not published separately (46 counties, $61 an acre combined)
NASS combined Baker County, Bay County, Bradford County, Brevard County, Broward County, Calhoun County, Citrus County, Clay County, Collier County, DeSoto County, Dixie County, Duval County, Flagler County, Franklin County, Gadsden County, Glades County, Gulf County, Hardee County, Hernando County, Highlands County, Indian River County, Jefferson County, Lafayette County, Lee County, Leon County, Liberty County, Martin County, Miami-Dade County, Monroe County, Nassau County, Okaloosa County, Orange County, Osceola County, Palm Beach County, Pasco County, Pinellas County, Polk County, Putnam County, Sarasota County, Seminole County, St. Johns County, St. Lucie County, Taylor County, Union County, Volusia County and Wakulla County into "other counties", so they have no figure of their own.
| Rank | County | Figure (dollars an acre) | Precision (CV) |
|---|---|---|---|
| 1 | Santa Rosa County | $107 | 6.8% |
| 2 | Escambia County | $95.50 | 6.4% |
| 3 | Hamilton County | $65 | 5.9% |
| 4 | Levy County | $58 | 13.6% |
| 5 | Jackson County | $57.50 | 7.6% |
| 6 | Gilchrist County This county | $55 | 10.1% |
| 7 | Suwannee County | $52 | 9.5% |
| 8 | Sumter County | $51.50 | 13.3% |
| 9 | Holmes County | $48 | 9.0% |
| 10 | Lake County | $45.50 | 15.3% |
| 11 | Washington County | $43.50 | 7.3% |
| 12 | Hillsborough County | $43 | 16.9% |
| 13 | Alachua County | $42.50 | 9.3% |
| 14 | Hendry County | $41.50 | 7.8% |
| 15 | Manatee County | $41 | 9.4% |
| 15 | Okeechobee County | $41 | 3.6% |
| 15 | Walton County | $41 | 10.5% |
| 18 | Columbia County | $35 | 9.7% |
| 19 | Marion County | $30 | 16.5% |
| 20 | Charlotte County | $26.50 | 4.5% |
| 21 | Madison County | $22 | 9.8% |
What this measures
NASS asks farm operators what they pay in cash rent per acre, separately for irrigated cropland, non-irrigated cropland and pasture. State figures come out at the end of July; county figures follow in August. When too few farms in a county answer, NASS combines that county with others and publishes one "other counties" figure, so some counties have no figure of their own.