Farm & food prices · Production and land
Cash rent for non-irrigated cropland: Humboldt County, Iowa
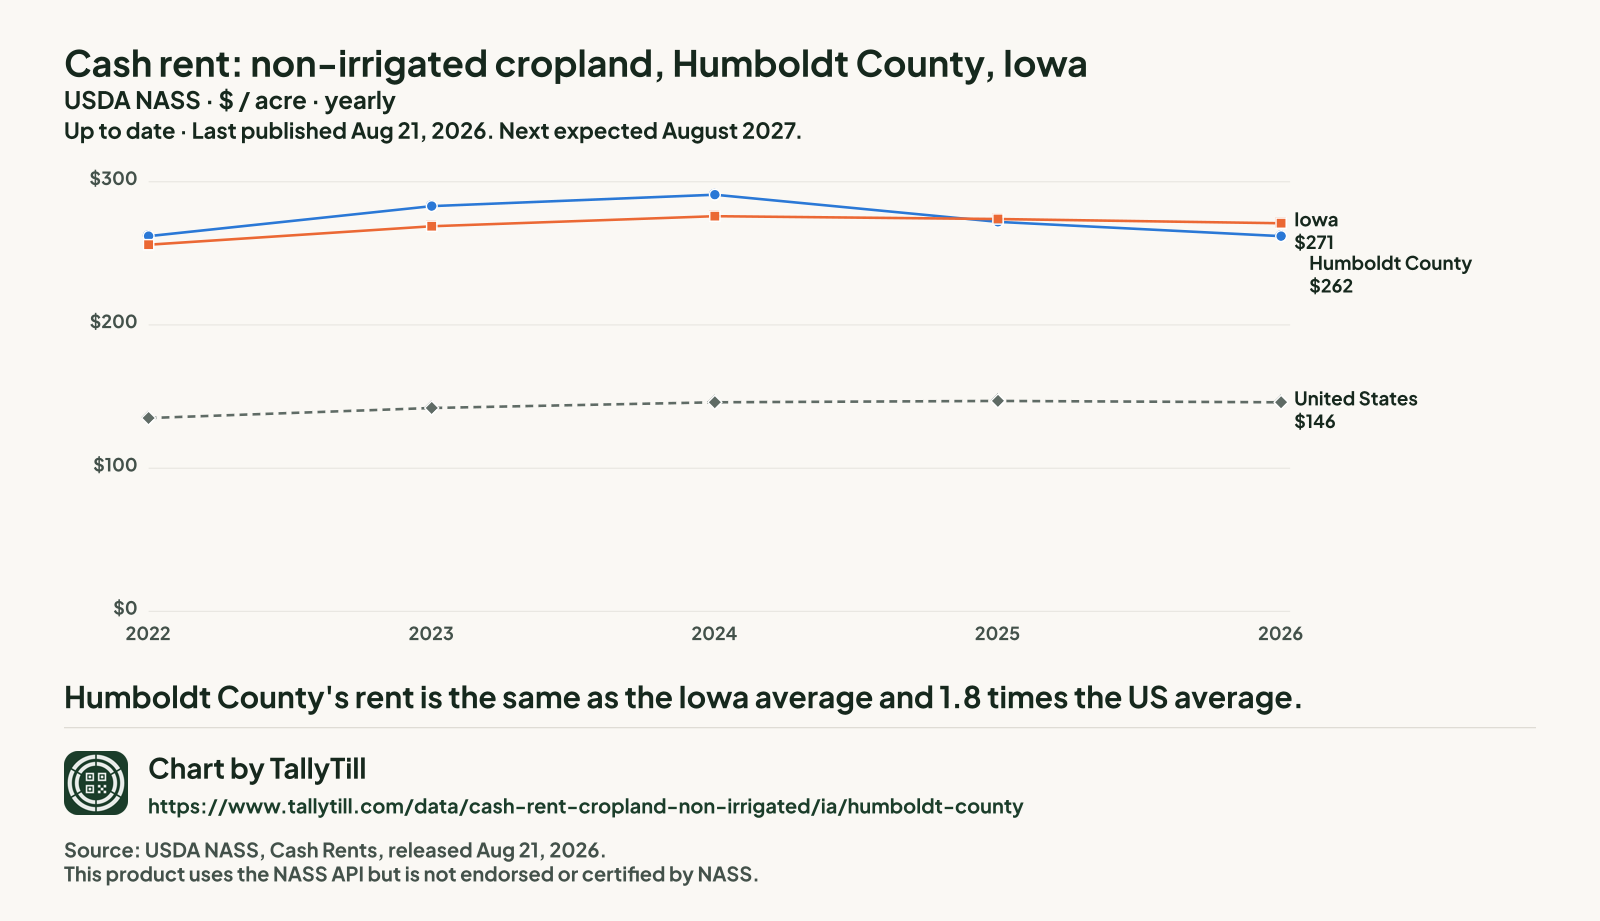
The average cash rent farmers paid per acre for non-irrigated cropland, from USDA's yearly cash rents survey.
Up to dateYearly. States at the end of July, counties in August. Last published Aug 21, 2026. Next expected August 2027.
The latest figures and how they have changed
Humboldt County, 2026
$262 an acre
Down 3.7% from $272 in 2025
Iowa, 2026
$271 an acre
Down 1.1% from $274 in 2025
United States, 2026
$146 an acre
Down 0.7% from $147 in 2025
Humboldt CountyIowaUnited States
 Chart by TallyTill · tallytill.com
View the dataOpen every figure behind this chart in a table.Save imageSave this chart as a picture.
What the numbers say
- Humboldt County's rent is the same as the Iowa average and 1.8 times the US average.
- It is tied for the 44th lowest of the 99 Iowa counties NASS published for 2026.
- Since 2022 it is unchanged at $262 an acre.
Every figure behind this chart
| Year | Humboldt County | Iowa | United States |
|---|---|---|---|
| 2026 | $262 | $271 | $146 |
| 2025 | $272 | $274 | $147 |
| 2024 | $291 | $276 | $146 |
| 2023 | $283 | $269 | $142 |
| 2022 | $262 | $256 | $135 |
ComparePut this series on one chart with another, and see whether the two can be compared.
Share chartGet a link and a preview picture of this chart to share.
Embed this chartGet the code to show this chart on your own website.
Every Iowa county, 2026
Darker shading means a higher figure. Values run from $167 an acre in Clarke County to $336 an acre in Sioux County.
- Under $241 (19 counties)
- $241 to under $258 (18 counties)
- $258 to under $274 (22 counties)
- $274 to under $288 (18 counties)
- $288 and over (22 counties)
| Rank | County | Figure (dollars an acre) | Precision (CV) |
|---|---|---|---|
| 1 | Sioux County | $336 | 5.5% |
| 2 | Grundy County | $322 | 2.3% |
| 3 | O Brien County | $310 | 5.4% |
| 4 | Carroll County | $305 | 2.8% |
| 5 | Clinton County | $304 | 3.6% |
| 6 | Benton County | $303 | 3.7% |
| 6 | Dubuque County | $303 | 1.8% |
| 8 | Audubon County | $302 | 3.1% |
| 9 | Butler County | $301 | 4.4% |
| 9 | Cherokee County | $301 | 4.9% |
| 9 | Hamilton County | $301 | 2.7% |
| 12 | Delaware County | $298 | 3.3% |
| 13 | Cedar County | $297 | 2.8% |
| 14 | Buchanan County | $293 | 1.5% |
| 14 | Floyd County | $293 | 3.9% |
| 16 | Bremer County | $291 | 2.6% |
| 16 | Ida County | $291 | 2.7% |
| 18 | Sac County | $290 | 2.4% |
| 18 | Story County | $290 | 3.3% |
| 20 | Muscatine County | $288 | 2.9% |
| 20 | Plymouth County | $288 | 1.8% |
| 20 | Woodbury County | $288 | 2.8% |
| 23 | Marshall County | $286 | 2.7% |
| 23 | Washington County | $286 | 2.8% |
| 25 | Chickasaw County | $284 | 4.7% |
| 25 | Lyon County | $284 | 2.1% |
| 25 | Scott County | $284 | 3.4% |
| 28 | Howard County | $283 | 3.0% |
| 28 | Osceola County | $283 | 3.7% |
| 30 | Kossuth County | $282 | 2.0% |
| 30 | Palo Alto County | $282 | 2.0% |
| 32 | Crawford County | $281 | 2.2% |
| 33 | Hardin County | $280 | 2.4% |
| 34 | Jones County | $279 | 4.1% |
| 35 | Poweshiek County | $278 | 2.1% |
| 36 | Johnson County | $277 | 3.2% |
| 36 | Mitchell County | $277 | 4.3% |
| 38 | Jackson County | $275 | 4.4% |
| 38 | Webster County | $275 | 2.9% |
| 40 | Winneshiek County | $274 | 4.0% |
| 41 | Monona County | $272 | 4.2% |
| 42 | Franklin County | $271 | 2.0% |
| 43 | Fayette County | $270 | 2.4% |
| 43 | Shelby County | $270 | 2.1% |
| 45 | Iowa County | $269 | 2.0% |
| 45 | Pocahontas County | $269 | 1.5% |
| 47 | Greene County | $268 | 2.1% |
| 48 | Calhoun County | $267 | 2.3% |
| 48 | Wright County | $267 | 2.1% |
| 50 | Clayton County | $266 | 2.7% |
| 50 | Union County | $266 | 5.4% |
| 52 | Hancock County | $265 | 2.1% |
| 53 | Jasper County | $264 | 2.4% |
| 54 | Boone County | $263 | 2.9% |
| 55 | Humboldt County This county | $262 | 3.2% |
| 55 | Winnebago County | $262 | 2.3% |
| 57 | Buena Vista County | $260 | 2.5% |
| 57 | Cerro Gordo County | $260 | 2.3% |
| 59 | Cass County | $259 | 4.0% |
| 60 | Linn County | $258 | 2.7% |
| 60 | Mills County | $258 | 2.5% |
| 60 | Polk County | $258 | 3.4% |
| 63 | Black Hawk County | $257 | 4.5% |
| 63 | Tama County | $257 | 3.5% |
| 65 | Harrison County | $255 | 2.1% |
| 65 | Pottawattamie County | $255 | 3.2% |
| 67 | Des Moines County | $253 | 6.1% |
| 67 | Henry County | $253 | 5.0% |
| 69 | Allamakee County | $252 | 4.2% |
| 70 | Clay County | $248 | 3.0% |
| 70 | Guthrie County | $248 | 3.8% |
| 70 | Montgomery County | $248 | 1.9% |
| 73 | Dickinson County | $247 | 3.2% |
| 73 | Wapello County | $247 | 1.7% |
| 75 | Jefferson County | $244 | 4.3% |
| 75 | Mahaska County | $244 | 2.7% |
| 77 | Lee County | $242 | 2.7% |
| 77 | Louisa County | $242 | 5.7% |
| 79 | Dallas County | $241 | 3.2% |
| 79 | Worth County | $241 | 2.2% |
| 81 | Emmet County | $239 | 3.6% |
| 82 | Adair County | $237 | 2.6% |
| 83 | Keokuk County | $236 | 2.8% |
| 83 | Page County | $236 | 4.0% |
| 85 | Adams County | $232 | 4.6% |
| 86 | Marion County | $230 | 3.8% |
| 87 | Taylor County | $228 | 2.8% |
| 88 | Madison County | $221 | 3.4% |
| 89 | Warren County | $218 | 1.7% |
| 90 | Fremont County | $215 | 4.6% |
| 91 | Ringgold County | $201 | 7.5% |
| 92 | Wayne County | $199 | 8.7% |
| 93 | Van Buren County | $197 | 3.5% |
| 94 | Davis County | $182 | 4.0% |
| 95 | Lucas County | $176 | 5.1% |
| 96 | Monroe County | $174 | 5.9% |
| 97 | Appanoose County | $173 | 6.1% |
| 98 | Clarke County | $167 | 3.0% |
| 98 | Decatur County | $167 | 3.7% |
Source: USDA National Agricultural Statistics Service (NASS), Cash Rents Survey. County estimates released Aug 21, 2026; state and US estimates released Jul 31, 2026. Quick Stats item "RENT, CASH, CROPLAND, NON-IRRIGATED - EXPENSE, MEASURED IN $ / ACRE". Retrieved Oct 20, 2026; snapshot 2026-10-20.1. Precision: NASS's coefficient of variation for Humboldt is 3.2% (lower means more precise). Dollars as published, not adjusted for inflation. This product uses the NASS API but is not endorsed or certified by NASS.
What this measures
NASS asks farm operators what they pay in cash rent per acre, separately for irrigated cropland, non-irrigated cropland and pasture. State figures come out at the end of July; county figures follow in August. When too few farms in a county answer, NASS combines that county with others and publishes one "other counties" figure, so some counties have no figure of their own.