Cash rent for non-irrigated cropland: De Kalb County, Illinois
The average cash rent farmers paid per acre for non-irrigated cropland, from USDA's yearly cash rents survey.
The latest figures and how they have changed
 Chart by TallyTill · tallytill.com
What the numbers say
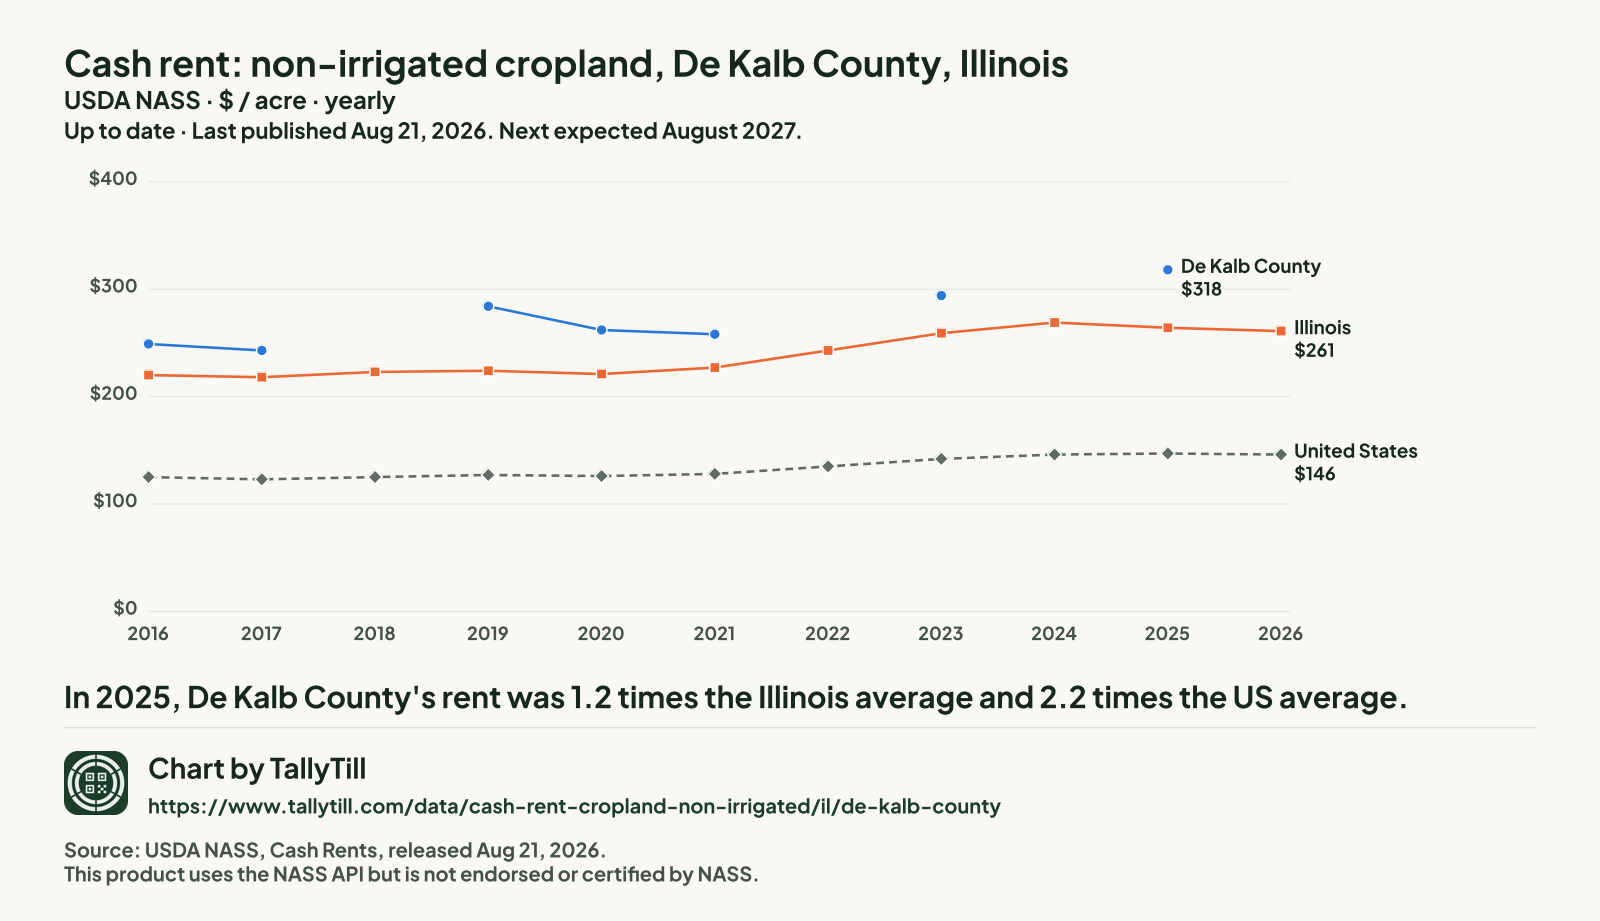
- In 2025, De Kalb County's rent was 1.2 times the Illinois average and 2.2 times the US average.
- It is the 9th highest of the 95 Illinois counties NASS published for 2025.
- From 2016 to 2025 it rose 27.7%, from $249 to $318 an acre.
- Gaps are years with no separate De Kalb figure: NASS ran no county survey in 2018, and in 2022, 2024 and 2026 it combined De Kalb into "other counties". Nothing is filled in.
Every figure behind this chart
| Year | De Kalb County | Illinois | United States |
|---|---|---|---|
| 2026 | Combined into "other counties" | $261 | $146 |
| 2025 | $318 | $264 | $147 |
| 2024 | Combined into "other counties" | $269 | $146 |
| 2023 | $294 | $259 | $142 |
| 2022 | Combined into "other counties" | $243 | $135 |
| 2021 | $258 | $227 | $128 |
| 2020 | $262 | $221 | $126 |
| 2019 | $284 | $224 | $127 |
| 2018 | No county survey that year | $223 | $125 |
| 2017 | $243 | $218 | $123 |
| 2016 | $249 | $220 | $125 |
Every Illinois county, 2026
Darker shading means a higher figure. Values run from $86.50 an acre in Union County to $347 an acre in Macon County.
- Under $40 (0 counties)
- $40 to under $80 (0 counties)
- $80 to under $120 (2 counties)
- $120 to under $160 (9 counties)
- $160 and over (75 counties)
- Not published separately (16 counties, $254 an acre combined)
NASS combined Alexander County, Clay County, Clinton County, DeKalb County, DuPage County, Hamilton County, Hardin County, Henry County, Iroquois County, Johnson County, Livingston County, Massac County, Piatt County, Pope County, Stephenson County and Woodford County into "other counties", so they have no figure of their own.
DeKalb: not published separately.
| Rank | County | Figure (dollars an acre) | Precision (CV) |
|---|---|---|---|
| 1 | Macon County | $347 | 4.8% |
| 2 | Moultrie County | $337 | 2.6% |
| 3 | Sangamon County | $334 | 2.9% |
| 4 | Christian County | $332 | 3.5% |
| 5 | Logan County | $326 | 2.4% |
| 5 | McLean County | $326 | 4.6% |
| 7 | Champaign County | $316 | 4.7% |
| 8 | Douglas County | $313 | 2.2% |
| 9 | Cass County | $306 | 2.5% |
| 10 | Bureau County | $301 | 2.5% |
| 10 | De Witt County | $301 | 4.4% |
| 12 | Kendall County | $297 | 3.9% |
| 13 | Knox County | $296 | 5.2% |
| 14 | Ford County | $294 | 1.4% |
| 15 | Marshall County | $293 | 4.9% |
| 15 | McDonough County | $293 | 2.0% |
| 17 | Henderson County | $292 | 3.4% |
| 17 | Stark County | $292 | 3.5% |
| 19 | Grundy County | $291 | 2.8% |
| 19 | Montgomery County | $291 | 6.2% |
| 21 | Carroll County | $290 | 4.1% |
| 22 | Menard County | $288 | 3.2% |
| 23 | Coles County | $286 | 4.3% |
| 24 | Hancock County | $284 | 2.6% |
| 25 | Lee County | $283 | 1.5% |
| 26 | Ogle County | $282 | 3.7% |
| 27 | Morgan County | $281 | 3.0% |
| 27 | Warren County | $281 | 2.6% |
| 29 | Greene County | $280 | 3.2% |
| 30 | La Salle County | $277 | 4.6% |
| 31 | Edgar County | $275 | 2.3% |
| 32 | Kane County | $274 | 3.8% |
| 33 | Mercer County | $273 | 3.7% |
| 33 | Scott County | $273 | 6.1% |
| 35 | Whiteside County | $270 | 3.2% |
| 36 | Boone County | $267 | 2.3% |
| 36 | Vermilion County | $267 | 3.1% |
| 38 | Tazewell County | $266 | 2.6% |
| 39 | Winnebago County | $264 | 3.0% |
| 40 | Fulton County | $263 | 2.8% |
| 41 | Mason County | $257 | 2.8% |
| 42 | Jo Daviess County | $255 | 3.5% |
| 42 | Shelby County | $255 | 2.5% |
| 44 | Peoria County | $253 | 3.0% |
| 45 | Kankakee County | $250 | 3.2% |
| 46 | Bond County | $249 | 4.8% |
| 46 | Madison County | $249 | 4.3% |
| 46 | Schuyler County | $249 | 8.0% |
| 49 | Clark County | $248 | 9.3% |
| 50 | Putnam County | $246 | 4.8% |
| 51 | Macoupin County | $245 | 3.0% |
| 52 | St Clair County | $243 | 3.1% |
| 53 | Adams County | $238 | 2.6% |
| 54 | McHenry County | $234 | 3.8% |
| 55 | Brown County | $233 | 3.6% |
| 56 | Will County | $231 | 8.6% |
| 57 | Rock Island County | $228 | 2.4% |
| 58 | Jersey County | $221 | 5.7% |
| 59 | Lawrence County | $219 | 3.0% |
| 59 | Pike County | $219 | 4.4% |
| 61 | Cumberland County | $211 | 2.1% |
| 62 | Wabash County | $202 | 1.5% |
| 63 | Calhoun County | $201 | 2.9% |
| 64 | Crawford County | $200 | 4.1% |
| 65 | Effingham County | $199 | 3.1% |
| 66 | Richland County | $196 | 8.0% |
| 67 | Jasper County | $195 | 3.6% |
| 68 | Fayette County | $192 | 2.5% |
| 69 | Washington County | $190 | 3.6% |
| 70 | Wayne County | $176 | 4.7% |
| 71 | White County | $175 | 2.7% |
| 72 | Jackson County | $172 | 3.9% |
| 72 | Marion County | $172 | 7.9% |
| 72 | Perry County | $172 | 8.6% |
| 75 | Randolph County | $166 | 7.7% |
| 76 | Edwards County | $156 | 4.0% |
| 77 | Gallatin County | $155 | 6.2% |
| 78 | Pulaski County | $152 | 4.2% |
| 79 | Monroe County | $151 | 2.5% |
| 80 | Saline County | $150 | 2.5% |
| 81 | Cook County | $136 | 2.7% |
| 81 | Jefferson County | $136 | 6.3% |
| 83 | Franklin County | $126 | 5.7% |
| 84 | Lake County | $125 | 7.0% |
| 85 | Williamson County | $101 | 4.5% |
| 86 | Union County | $86.50 | 5.1% |
What this measures
NASS asks farm operators what they pay in cash rent per acre, separately for irrigated cropland, non-irrigated cropland and pasture. State figures come out at the end of July; county figures follow in August. When too few farms in a county answer, NASS combines that county with others and publishes one "other counties" figure, so some counties have no figure of their own.