Cash rent for non-irrigated cropland: Elkhart County, Indiana
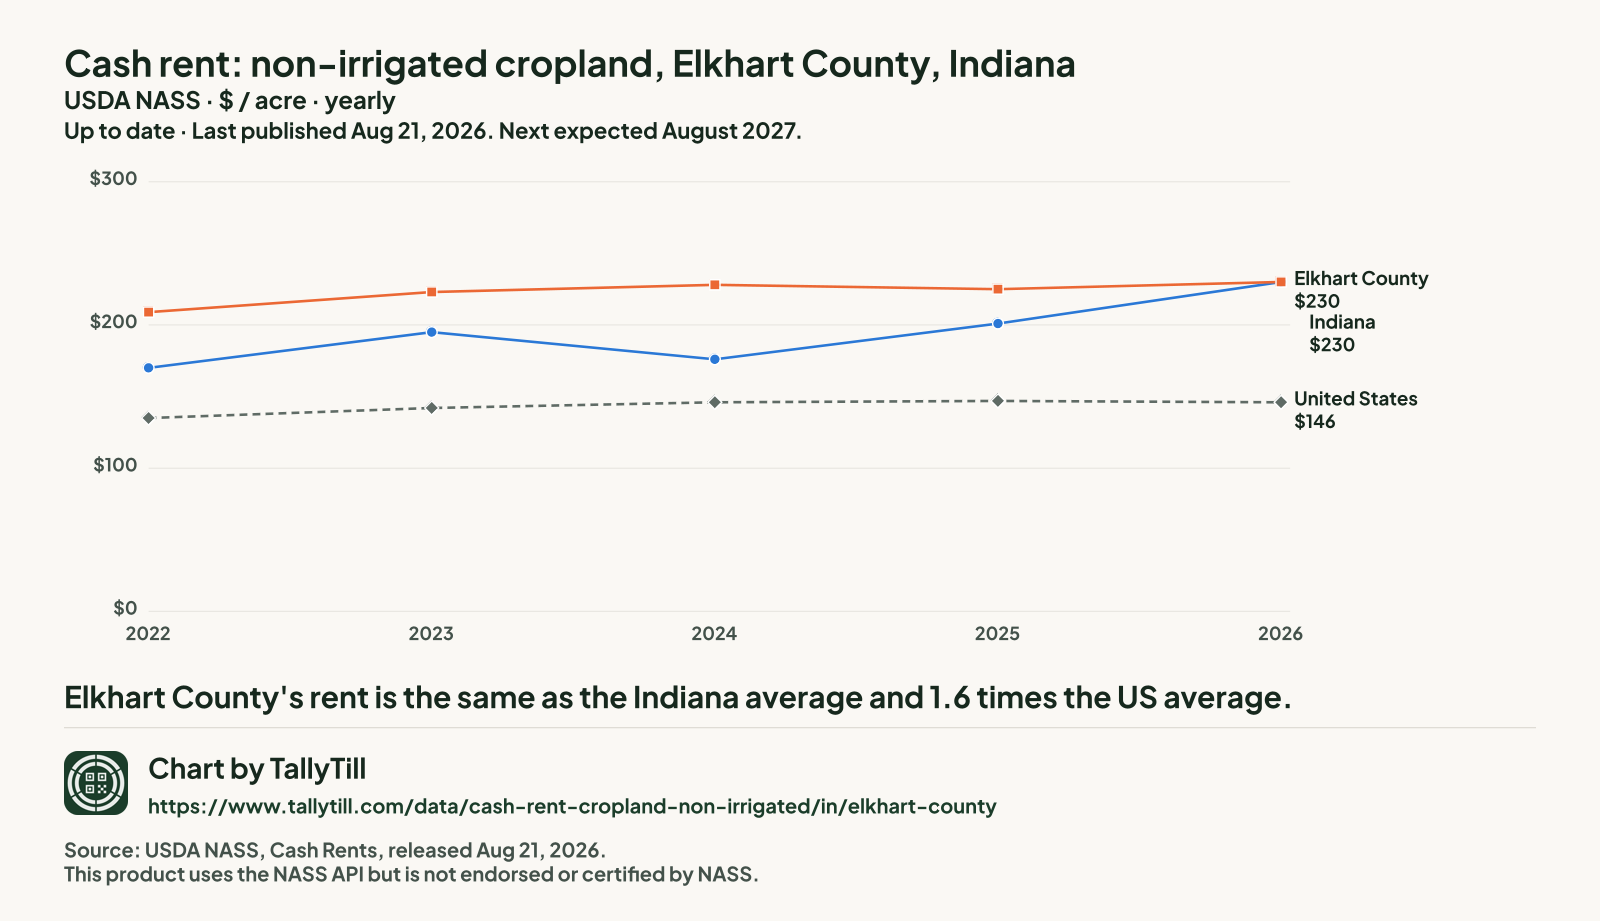
The average cash rent farmers paid per acre for non-irrigated cropland, from USDA's yearly cash rents survey.
The latest figures and how they have changed
 Chart by TallyTill · tallytill.com
What the numbers say
- Elkhart County's rent is the same as the Indiana average and 1.6 times the US average.
- It is tied for the 31st highest of the 89 Indiana counties NASS published for 2026.
- Since 2022 it has risen 35.3%, from $170 to $230 an acre.
Every figure behind this chart
| Year | Elkhart County | Indiana | United States |
|---|---|---|---|
| 2026 | $230 | $230 | $146 |
| 2025 | $201 | $225 | $147 |
| 2024 | $176 | $228 | $146 |
| 2023 | $195 | $223 | $142 |
| 2022 | $170 | $209 | $135 |
Every Indiana county, 2026
Darker shading means a higher figure. Values run from $127 an acre in Perry County to $303 an acre in Warren County.
- Under $177 (17 counties)
- $177 to under $200 (16 counties)
- $200 to under $224 (19 counties)
- $224 to under $246 (19 counties)
- $246 and over (18 counties)
- Not published separately (3 counties, $95 an acre combined)
NASS combined Crawford County, Floyd County and Ohio County into "other counties", so they have no figure of their own.
| Rank | County | Figure (dollars an acre) | Precision (CV) |
|---|---|---|---|
| 1 | Warren County | $303 | 4.0% |
| 2 | Benton County | $300 | 3.8% |
| 3 | Clinton County | $298 | 2.9% |
| 4 | Montgomery County | $287 | 4.2% |
| 5 | Wells County | $279 | 3.6% |
| 6 | Carroll County | $275 | 2.0% |
| 6 | Tipton County | $275 | 1.7% |
| 8 | Vermillion County | $270 | 4.8% |
| 9 | Tippecanoe County | $267 | 4.2% |
| 10 | Fountain County | $265 | 3.5% |
| 11 | Boone County | $264 | 2.6% |
| 12 | White County | $263 | 5.8% |
| 13 | Hendricks County | $260 | 6.3% |
| 14 | Daviess County | $255 | 2.0% |
| 14 | Fayette County | $255 | 3.8% |
| 14 | Howard County | $255 | 5.7% |
| 17 | Shelby County | $249 | 3.1% |
| 18 | Blackford County | $246 | 3.5% |
| 19 | Madison County | $245 | 3.7% |
| 20 | Vigo County | $244 | 3.1% |
| 21 | Rush County | $242 | 3.3% |
| 22 | Delaware County | $240 | 2.9% |
| 22 | Hancock County | $240 | 3.0% |
| 24 | Hamilton County | $239 | 3.4% |
| 25 | Cass County | $237 | 3.6% |
| 26 | Adams County | $235 | 3.6% |
| 26 | Decatur County | $235 | 2.5% |
| 26 | Jasper County | $235 | 3.2% |
| 26 | Newton County | $235 | 5.1% |
| 30 | Vanderburgh County | $233 | 4.5% |
| 31 | Elkhart County This county | $230 | 7.9% |
| 31 | Sullivan County | $230 | 4.8% |
| 33 | Knox County | $229 | 2.3% |
| 34 | Johnson County | $228 | 3.4% |
| 35 | Posey County | $225 | 3.4% |
| 36 | Bartholomew County | $224 | 2.3% |
| 36 | Putnam County | $224 | 2.2% |
| 38 | Union County | $220 | 4.7% |
| 39 | Allen County | $219 | 9.8% |
| 39 | Kosciusko County | $219 | 4.2% |
| 39 | Marshall County | $219 | 3.6% |
| 42 | Clay County | $218 | 3.2% |
| 42 | Miami County | $218 | 3.6% |
| 44 | Jay County | $217 | 3.0% |
| 44 | Pulaski County | $217 | 3.6% |
| 46 | Gibson County | $216 | 5.4% |
| 47 | Wayne County | $214 | 3.7% |
| 48 | Jennings County | $209 | 4.4% |
| 48 | Orange County | $209 | 9.4% |
| 48 | Randolph County | $209 | 3.7% |
| 51 | Fulton County | $208 | 2.9% |
| 52 | Henry County | $203 | 4.3% |
| 53 | Wabash County | $201 | 2.4% |
| 54 | Dubois County | $200 | 6.7% |
| 54 | Huntington County | $200 | 6.2% |
| 54 | La Porte County | $200 | 4.5% |
| 57 | Whitley County | $199 | 2.6% |
| 58 | Greene County | $197 | 3.6% |
| 58 | Parke County | $197 | 2.9% |
| 60 | Jackson County | $196 | 4.0% |
| 60 | St. Joseph County | $196 | 3.5% |
| 62 | Grant County | $195 | 4.0% |
| 62 | Porter County | $195 | 4.0% |
| 64 | Pike County | $194 | 3.7% |
| 65 | Martin County | $190 | 5.2% |
| 65 | Morgan County | $190 | 2.8% |
| 65 | Noble County | $190 | 3.6% |
| 68 | Lake County | $186 | 2.7% |
| 69 | Marion County | $185 | 3.7% |
| 69 | Spencer County | $185 | 4.2% |
| 71 | Lawrence County | $179 | 10.4% |
| 72 | Franklin County | $177 | 3.0% |
| 73 | Warrick County | $175 | 5.7% |
| 74 | Ripley County | $174 | 4.0% |
| 75 | Harrison County | $170 | 3.6% |
| 75 | Starke County | $170 | 3.7% |
| 77 | Washington County | $168 | 2.3% |
| 78 | Owen County | $162 | 5.0% |
| 79 | LaGrange County | $159 | 7.1% |
| 80 | Scott County | $155 | 3.7% |
| 81 | Steuben County | $153 | 3.2% |
| 82 | Clark County | $150 | 3.2% |
| 82 | Jefferson County | $150 | 3.9% |
| 84 | Monroe County | $149 | 6.0% |
| 85 | Dearborn County | $147 | 3.4% |
| 86 | De Kalb County | $146 | 5.1% |
| 87 | Brown County | $134 | 9.1% |
| 87 | Switzerland County | $134 | 4.6% |
| 89 | Perry County | $127 | 5.6% |
What this measures
NASS asks farm operators what they pay in cash rent per acre, separately for irrigated cropland, non-irrigated cropland and pasture. State figures come out at the end of July; county figures follow in August. When too few farms in a county answer, NASS combines that county with others and publishes one "other counties" figure, so some counties have no figure of their own.