Cash rent for non-irrigated cropland: Clark County, Kansas
The average cash rent farmers paid per acre for non-irrigated cropland, from USDA's yearly cash rents survey.
The latest figures and how they have changed
 Chart by TallyTill · tallytill.com
What the numbers say
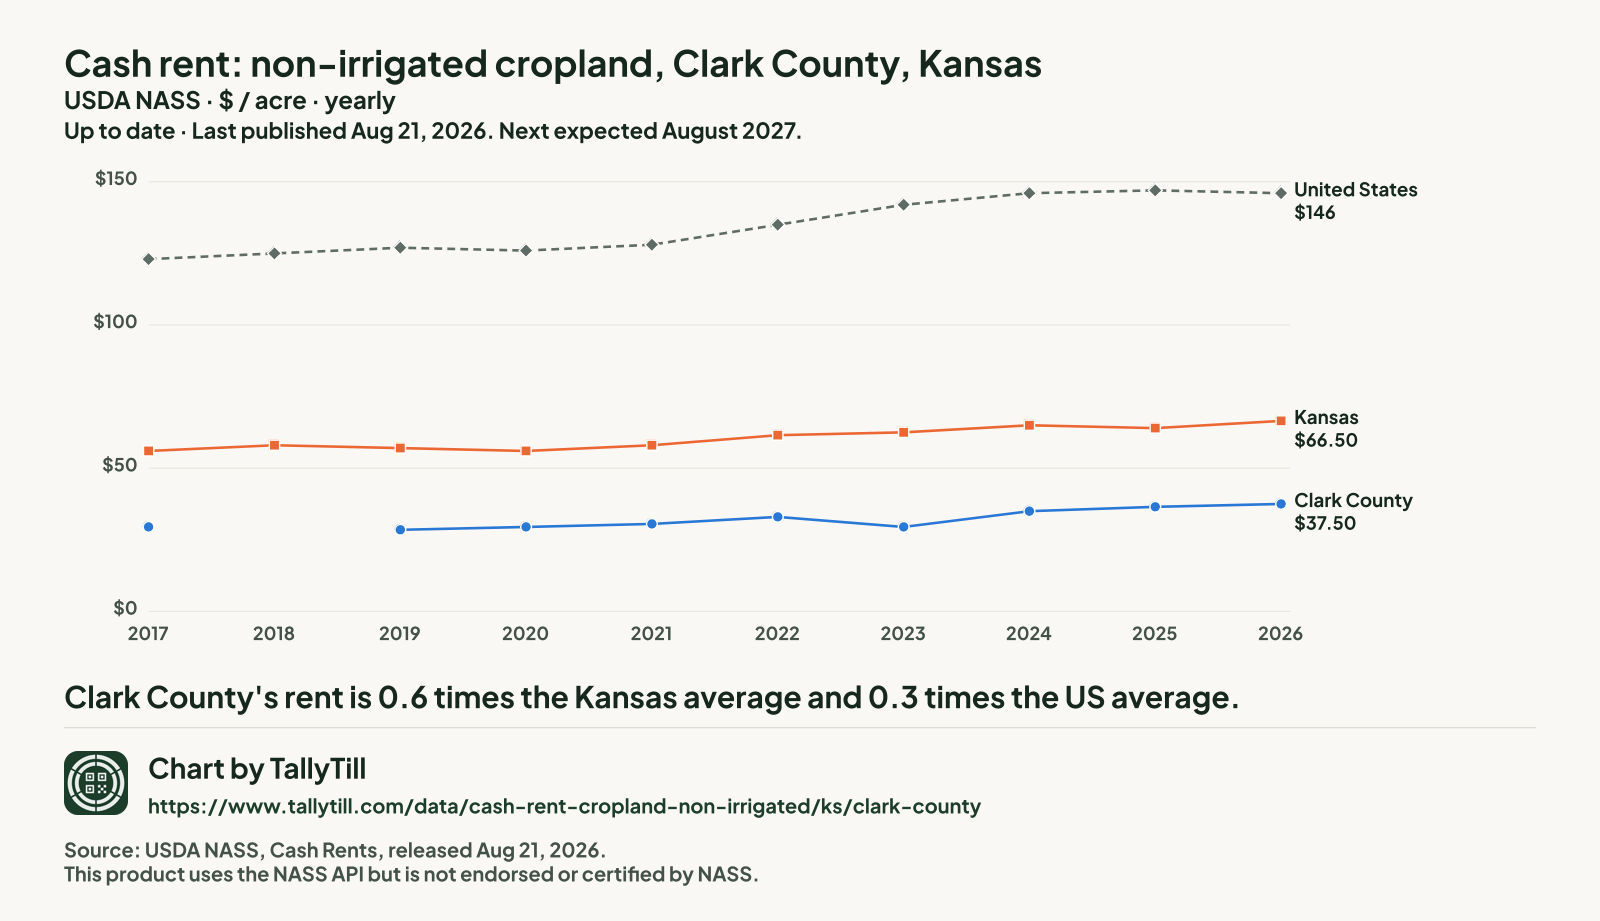
- Clark County's rent is 0.6 times the Kansas average and 0.3 times the US average.
- It is tied for the 9th lowest of the 102 Kansas counties NASS published for 2026.
- Since 2017 it has risen 27.1%, from $29.50 to $37.50 an acre.
- Gaps are years with no separate Clark figure: NASS ran no county survey in 2018. Nothing is filled in.
Every figure behind this chart
| Year | Clark County | Kansas | United States |
|---|---|---|---|
| 2026 | $37.50 | $66.50 | $146 |
| 2025 | $36.50 | $64 | $147 |
| 2024 | $35 | $65 | $146 |
| 2023 | $29.50 | $62.50 | $142 |
| 2022 | $33 | $61.50 | $135 |
| 2021 | $30.50 | $58 | $128 |
| 2020 | $29.50 | $56 | $126 |
| 2019 | $28.50 | $57 | $127 |
| 2018 | No county survey that year | $58 | $125 |
| 2017 | $29.50 | $56 | $123 |
Every Kansas county, 2026
Darker shading means a higher figure. Values run from $29.50 an acre in Morton County to $193 an acre in Doniphan County.
- Under $40 (11 counties)
- $40 to under $80 (73 counties)
- $80 to under $120 (13 counties)
- $120 to under $160 (3 counties)
- $160 and over (2 counties)
- Not published separately (3 counties, $44 an acre combined)
NASS combined Chautauqua County, Ellis County and Wyandotte County into "other counties", so they have no figure of their own.
| Rank | County | Figure (dollars an acre) | Precision (CV) |
|---|---|---|---|
| 1 | Doniphan County | $193 | 3.5% |
| 2 | Brown County | $184 | 3.1% |
| 3 | Nemaha County | $159 | 6.2% |
| 4 | Atchison County | $131 | 8.5% |
| 5 | Marshall County | $126 | 3.9% |
| 6 | Cloud County | $115 | 10.7% |
| 7 | Republic County | $99.50 | 4.0% |
| 8 | Clay County | $99 | 6.4% |
| 9 | Pottawatomie County | $97.50 | 7.9% |
| 10 | Linn County | $97 | 8.3% |
| 11 | Jackson County | $91.50 | 6.9% |
| 11 | Washington County | $91.50 | 6.7% |
| 13 | Riley County | $87.50 | 7.6% |
| 14 | Miami County | $86.50 | 12.9% |
| 15 | Leavenworth County | $85.50 | 13.3% |
| 16 | Douglas County | $84.50 | 9.2% |
| 17 | Jewell County | $82.50 | 3.4% |
| 18 | Jefferson County | $82 | 4.6% |
| 19 | Geary County | $76.50 | 3.2% |
| 20 | Mitchell County | $76 | 2.8% |
| 20 | Ottawa County | $76 | 8.4% |
| 22 | Smith County | $75.50 | 3.5% |
| 23 | Wilson County | $75 | 5.0% |
| 24 | Franklin County | $74.50 | 13.1% |
| 25 | Crawford County | $73.50 | 5.7% |
| 26 | Lyon County | $71.50 | 3.8% |
| 27 | Shawnee County | $71 | 4.1% |
| 28 | Allen County | $70.50 | 7.9% |
| 28 | Anderson County | $70.50 | 3.8% |
| 28 | Johnson County | $70.50 | 6.5% |
| 28 | McPherson County | $70.50 | 3.1% |
| 32 | Cherokee County | $70 | 4.4% |
| 32 | Osage County | $70 | 8.5% |
| 34 | Lincoln County | $68.50 | 5.2% |
| 35 | Montgomery County | $68 | 7.2% |
| 36 | Harvey County | $67.50 | 4.3% |
| 37 | Rawlins County | $66.50 | 3.8% |
| 38 | Saline County | $65 | 3.0% |
| 38 | Thomas County | $65 | 3.2% |
| 40 | Bourbon County | $63.50 | 5.2% |
| 40 | Sheridan County | $63.50 | 4.8% |
| 42 | Chase County | $63 | 11.3% |
| 42 | Sherman County | $63 | 7.0% |
| 42 | Wabaunsee County | $63 | 7.4% |
| 45 | Dickinson County | $62 | 4.8% |
| 46 | Coffey County | $61.50 | 6.7% |
| 46 | Morris County | $61.50 | 4.2% |
| 48 | Greenwood County | $61 | 14.0% |
| 48 | Labette County | $61 | 5.8% |
| 50 | Woodson County | $58.50 | 8.5% |
| 51 | Osborne County | $58 | 3.9% |
| 51 | Phillips County | $58 | 2.5% |
| 53 | Sumner County | $57 | 7.2% |
| 54 | Rice County | $56.50 | 2.9% |
| 54 | Scott County | $56.50 | 4.4% |
| 56 | Sedgwick County | $56 | 2.8% |
| 57 | Marion County | $55.50 | 3.0% |
| 57 | Wichita County | $55.50 | 6.6% |
| 59 | Cheyenne County | $55 | 12.1% |
| 59 | Neosho County | $55 | 3.8% |
| 59 | Norton County | $55 | 4.4% |
| 62 | Butler County | $54 | 6.6% |
| 63 | Reno County | $53 | 3.9% |
| 64 | Decatur County | $52.50 | 4.7% |
| 64 | Wallace County | $52.50 | 9.0% |
| 66 | Cowley County | $52 | 3.8% |
| 67 | Elk County | $51 | 5.2% |
| 68 | Gove County | $50 | 2.4% |
| 68 | Logan County | $50 | 3.9% |
| 70 | Finney County | $49.50 | 5.6% |
| 70 | Gray County | $49.50 | 2.6% |
| 72 | Greeley County | $49 | 5.5% |
| 73 | Rooks County | $48.50 | 4.0% |
| 74 | Stafford County | $48 | 4.0% |
| 75 | Kingman County | $47.50 | 5.7% |
| 76 | Ford County | $47 | 8.1% |
| 76 | Harper County | $47 | 6.3% |
| 76 | Pawnee County | $47 | 6.7% |
| 79 | Meade County | $46 | 5.8% |
| 79 | Pratt County | $46 | 3.7% |
| 79 | Rush County | $46 | 5.7% |
| 82 | Ellsworth County | $45.50 | 4.6% |
| 83 | Barton County | $44.50 | 3.0% |
| 84 | Barber County | $43 | 5.5% |
| 85 | Russell County | $42 | 6.5% |
| 86 | Graham County | $41.50 | 3.0% |
| 86 | Ness County | $41.50 | 6.8% |
| 88 | Haskell County | $41 | 4.6% |
| 88 | Lane County | $41 | 3.4% |
| 88 | Trego County | $41 | 6.7% |
| 91 | Edwards County | $40.50 | 5.2% |
| 92 | Kiowa County | $39 | 6.9% |
| 93 | Clark County This county | $37.50 | 3.7% |
| 93 | Hodgeman County | $37.50 | 4.3% |
| 95 | Seward County | $37 | 13.2% |
| 96 | Stevens County | $36 | 4.4% |
| 97 | Comanche County | $35.50 | 4.6% |
| 98 | Hamilton County | $34 | 2.7% |
| 99 | Kearny County | $32.50 | 3.5% |
| 99 | Stanton County | $32.50 | 3.4% |
| 101 | Grant County | $30.50 | 4.8% |
| 102 | Morton County | $29.50 | 7.7% |
What this measures
NASS asks farm operators what they pay in cash rent per acre, separately for irrigated cropland, non-irrigated cropland and pasture. State figures come out at the end of July; county figures follow in August. When too few farms in a county answer, NASS combines that county with others and publishes one "other counties" figure, so some counties have no figure of their own.