Cash rent for non-irrigated cropland: Laurel County, Kentucky
The average cash rent farmers paid per acre for non-irrigated cropland, from USDA's yearly cash rents survey.
The latest figures and how they have changed
 Chart by TallyTill · tallytill.com
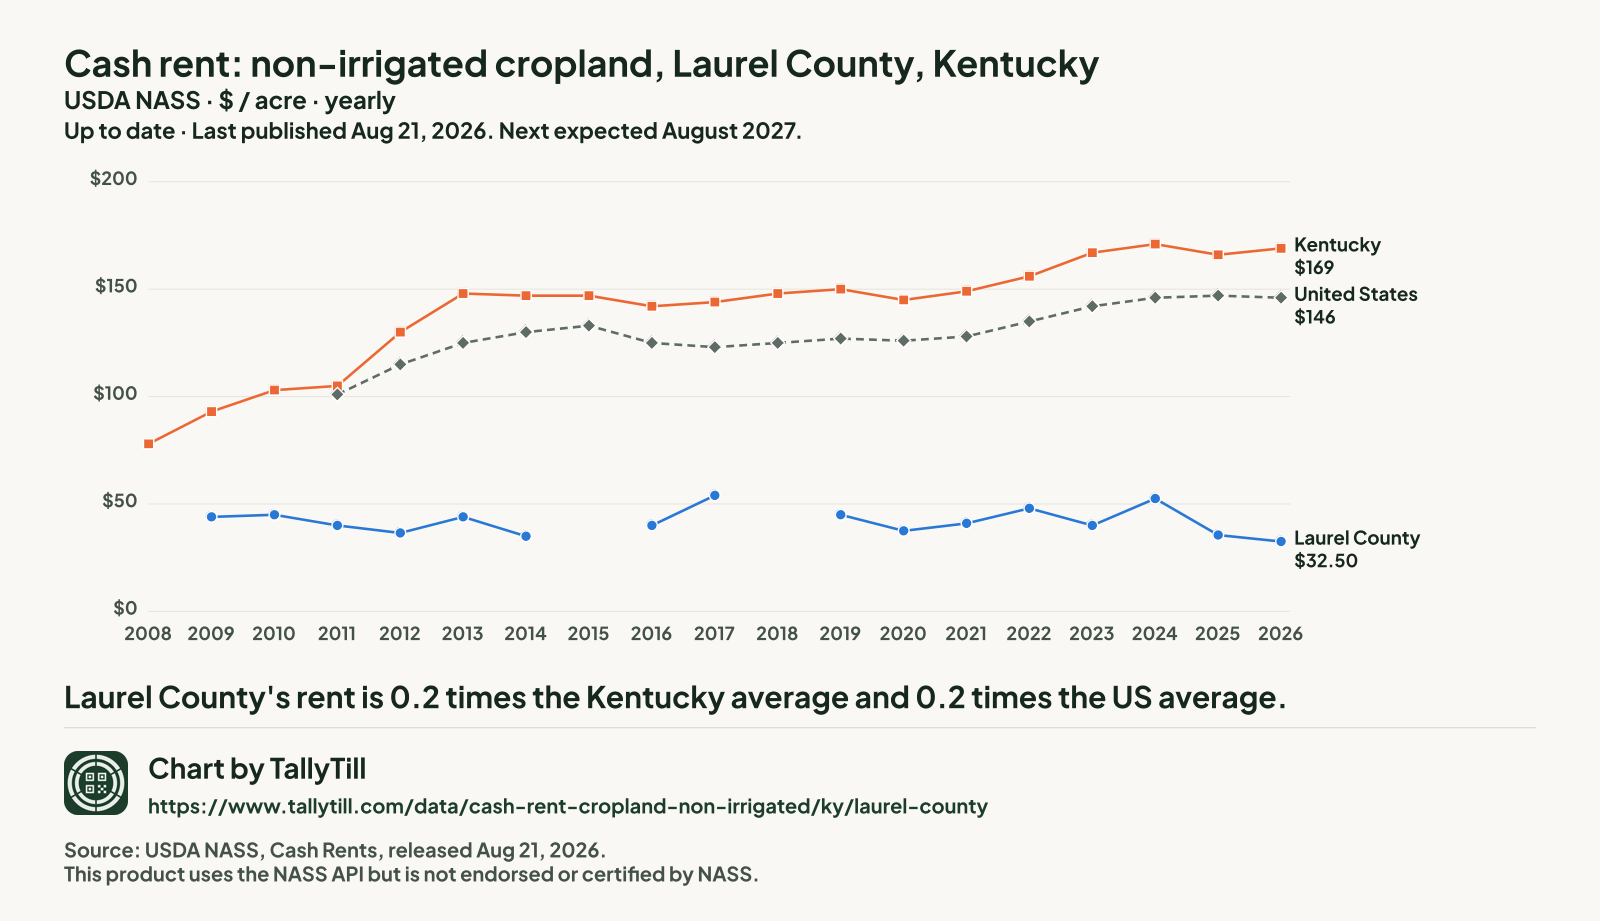
What the numbers say
- Laurel County's rent is 0.2 times the Kentucky average and 0.2 times the US average.
- It is the 5th lowest of the 86 Kentucky counties NASS published for 2026.
- Since 2009 it has fallen 26.1%, from $44 to $32.50 an acre.
- Gaps are years with no separate Laurel figure: NASS ran no county survey in 2015 or 2018, and NASS had no figure available in 2008. Nothing is filled in.
Every figure behind this chart
| Year | Laurel County | Kentucky | United States |
|---|---|---|---|
| 2026 | $32.50 | $169 | $146 |
| 2025 | $35.50 | $166 | $147 |
| 2024 | $52.50 | $171 | $146 |
| 2023 | $40 | $167 | $142 |
| 2022 | $48 | $156 | $135 |
| 2021 | $41 | $149 | $128 |
| 2020 | $37.50 | $145 | $126 |
| 2019 | $45 | $150 | $127 |
| 2018 | No county survey that year | $148 | $125 |
| 2017 | $54 | $144 | $123 |
| 2016 | $40 | $142 | $125 |
| 2015 | No county survey that year | $147 | $133 |
| 2014 | $35 | $147 | $130 |
| 2013 | $44 | $148 | $125 |
| 2012 | $36.50 | $130 | $115 |
| 2011 | $40 | $105 | $101 |
| 2010 | $45 | $103 | No figure |
| 2009 | $44 | $93 | No figure |
| 2008 | Not available | $78 | No figure |
Every Kentucky county, 2026
Darker shading means a higher figure. Values run from $17 an acre in Whitley County to $259 an acre in Union County.
- Under $40 (6 counties)
- $40 to under $80 (17 counties)
- $80 to under $120 (19 counties)
- $120 to under $160 (15 counties)
- $160 and over (29 counties)
- Not published separately (34 counties, $103 an acre combined)
NASS combined Bath County, Bell County, Boyd County, Boyle County, Breathitt County, Carter County, Clay County, Elliott County, Floyd County, Gallatin County, Harlan County, Jefferson County, Johnson County, Knott County, Knox County, Lawrence County, Lee County, Leslie County, Letcher County, Lewis County, Lyon County, Martin County, McCreary County, Menifee County, Nicholas County, Ohio County, Owen County, Owsley County, Perry County, Pike County, Powell County, Robertson County, Rowan County and Trimble County into "other counties", so they have no figure of their own.
| Rank | County | Figure (dollars an acre) | Precision (CV) |
|---|---|---|---|
| 1 | Union County | $259 | 3.4% |
| 2 | Henderson County | $236 | 8.8% |
| 3 | Logan County | $232 | 4.7% |
| 4 | Webster County | $229 | 4.8% |
| 5 | Simpson County | $217 | 8.4% |
| 6 | Daviess County | $207 | 7.7% |
| 7 | Christian County | $200 | 4.2% |
| 7 | Todd County | $200 | 7.1% |
| 7 | Warren County | $200 | 6.4% |
| 10 | Fulton County | $191 | 3.9% |
| 10 | McLean County | $191 | 4.3% |
| 12 | Larue County | $181 | 3.7% |
| 13 | Carlisle County | $180 | 4.9% |
| 13 | Hickman County | $180 | 4.9% |
| 13 | Metcalfe County | $180 | 12.5% |
| 13 | Nelson County | $180 | 8.1% |
| 17 | Trigg County | $175 | 6.8% |
| 18 | Meade County | $174 | 8.1% |
| 19 | Marion County | $173 | 6.4% |
| 20 | Caldwell County | $170 | 5.1% |
| 20 | Graves County | $170 | 7.1% |
| 22 | Crittenden County | $168 | 3.2% |
| 22 | Livingston County | $168 | 6.6% |
| 24 | Shelby County | $166 | 6.6% |
| 25 | Taylor County | $162 | 3.3% |
| 26 | Ballard County | $161 | 4.5% |
| 26 | Calloway County | $161 | 7.5% |
| 28 | Hancock County | $160 | 12.9% |
| 28 | Hopkins County | $160 | 15.1% |
| 30 | Barren County | $150 | 8.6% |
| 30 | Monroe County | $150 | 10.5% |
| 32 | Hart County | $148 | 6.0% |
| 32 | Muhlenberg County | $148 | 7.3% |
| 34 | Butler County | $144 | 5.7% |
| 35 | Green County | $142 | 6.7% |
| 35 | Hardin County | $142 | 12.3% |
| 37 | McCracken County | $140 | 6.3% |
| 38 | Fleming County | $132 | 12.1% |
| 39 | Marshall County | $131 | 12.0% |
| 40 | Wayne County | $130 | 10.4% |
| 41 | Adair County | $129 | 6.1% |
| 41 | Allen County | $129 | 5.0% |
| 43 | Breckinridge County | $127 | 12.9% |
| 44 | Spencer County | $122 | 16.5% |
| 45 | Edmonson County | $118 | 5.6% |
| 46 | Woodford County | $113 | 16.0% |
| 47 | Casey County | $111 | 12.1% |
| 48 | Grayson County | $110 | 4.3% |
| 48 | Scott County | $110 | 12.6% |
| 50 | Bourbon County | $105 | 11.8% |
| 50 | Pulaski County | $105 | 11.9% |
| 52 | Harrison County | $101 | 16.1% |
| 53 | Lincoln County | $97 | 9.1% |
| 54 | Oldham County | $95.50 | 16.9% |
| 55 | Henry County | $95 | 8.1% |
| 56 | Clark County | $93 | 9.9% |
| 57 | Russell County | $92 | 24.4% |
| 58 | Mason County | $90 | 11.4% |
| 59 | Clinton County | $85 | 19.3% |
| 60 | Bullitt County | $83 | 14.0% |
| 61 | Carroll County | $80 | 3.5% |
| 61 | Cumberland County | $80 | 4.6% |
| 61 | Fayette County | $80 | 8.2% |
| 64 | Mercer County | $79 | 21.5% |
| 65 | Grant County | $75.50 | 12.6% |
| 66 | Anderson County | $73 | 20.7% |
| 67 | Rockcastle County | $72 | 17.8% |
| 68 | Bracken County | $71 | 8.0% |
| 69 | Franklin County | $70 | 14.9% |
| 70 | Washington County | $61.50 | 5.1% |
| 71 | Garrard County | $60.50 | 12.5% |
| 72 | Jessamine County | $60 | 6.5% |
| 72 | Montgomery County | $60 | 15.8% |
| 74 | Wolfe County | $54.50 | 4.5% |
| 75 | Pendleton County | $50 | 15.2% |
| 76 | Kenton County | $46 | 9.1% |
| 77 | Boone County | $45 | 3.4% |
| 77 | Campbell County | $45 | 5.9% |
| 79 | Greenup County | $42.50 | 9.3% |
| 80 | Madison County | $40 | 9.0% |
| 81 | Magoffin County | $35 | 17.8% |
| 82 | Laurel County This county | $32.50 | 4.3% |
| 83 | Jackson County | $26.50 | 9.8% |
| 84 | Morgan County | $25 | 7.9% |
| 85 | Estill County | $22 | 11.6% |
| 86 | Whitley County | $17 | 6.5% |
What this measures
NASS asks farm operators what they pay in cash rent per acre, separately for irrigated cropland, non-irrigated cropland and pasture. State figures come out at the end of July; county figures follow in August. When too few farms in a county answer, NASS combines that county with others and publishes one "other counties" figure, so some counties have no figure of their own.