Farm & food prices · Production and land

Cash rent for non-irrigated cropland: Louisiana

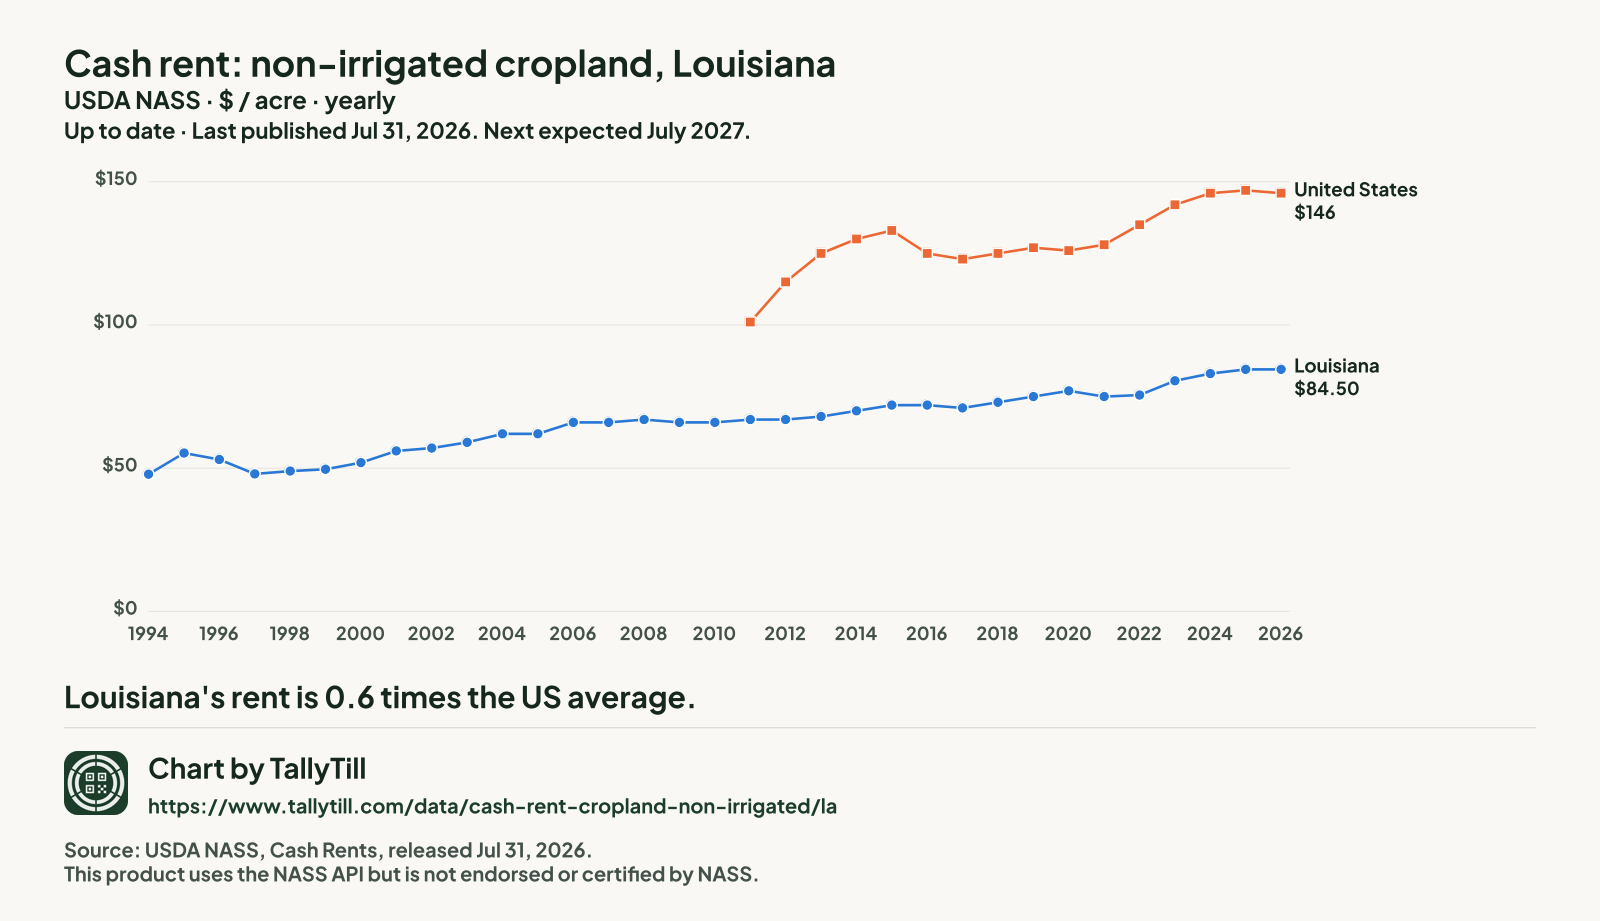
The average cash rent farmers paid per acre for non-irrigated cropland, from USDA's yearly cash rents survey.

Choose a place Show the figures for the place you chose.
Up to dateYearly. States at the end of July, counties in August. Last published Jul 31, 2026. Next expected July 2027.

The latest figures and how they have changed

Louisiana, 2026
$84.50 an acre
Unchanged from $84.50 in 2025
United States, 2026
$146 an acre
Down 0.7% from $147 in 2025
LouisianaUnited States
$0$50$100$15019941996199820002002200420062008201020122014201620182020202220242026Louisiana$84.50United States$146

Chart by TallyTill · tallytill.com

View the dataOpen every figure behind this chart in a table.Save imageSave this chart as a picture.

What the numbers say

  • Louisiana's rent is 0.6 times the US average.
  • Since 1994 it has risen 76.4%, from $47.90 to $84.50 an acre.

Every figure behind this chart

Cash rent: non-irrigated cropland, dollars an acre
YearLouisianaUnited States
2026$84.50$146
2025$84.50$147
2024$83$146
2023$80.50$142
2022$75.50$135
2021$75$128
2020$77$126
2019$75$127
2018$73$125
2017$71$123
2016$72$125
2015$72$133
2014$70$130
2013$68$125
2012$67$115
2011$67$101
2010$66No figure
2009$66No figure
2008$67No figure
2007$66No figure
2006$66No figure
2005$62No figure
2004$62No figure
2003$59No figure
2002$57No figure
2001$56No figure
2000$51.90No figure
1999$49.60No figure
1998$49No figure
1997$48No figure
1996$53No figure
1995$55.30No figure
1994$47.90No figure
Get a link and a preview picture of this chart to share. Get the code to show this chart on your own website.

Share this chart

FacebookShare this link on Facebook.XShare this link on X.LinkedInShare this link on LinkedIn.RedditShare this link on Reddit.PinterestShare this link on Pinterest.EmailEmail this link.Open the share menu on your device. Copy the link to your clipboard.

Embed this chart on your site

Copy the code to your clipboard.

The chart shows the latest figures TallyTill has collected and updates itself when a new release is collected. Keep the link under it: it credits the source and the explorer.

Every Louisiana parish, 2026

Darker shading means a higher figure. Values run from $14 an acre in Saint Tammany Parish to $143 an acre in Madison Parish.

Acadia Parish: $53.50 an acreAllen Parish: combined into "other counties"Ascension Parish: combined into "other counties"Assumption Parish: combined into "other counties"Avoyelles Parish: $115 an acreBeauregard Parish: $22 an acreBienville Parish: combined into "other counties"Bossier Parish: $38 an acreCaddo Parish: $71 an acreCalcasieu Parish: $20.50 an acreCaldwell Parish: $48.50 an acreCameron Parish: combined into "other counties"Catahoula Parish: $88 an acreClaiborne Parish: $19 an acreConcordia Parish: $119 an acreDe Soto Parish: $29.50 an acreEast Baton Rouge Parish: $18 an acreEast Carroll Parish: $130 an acreEast Feliciana Parish: $22 an acreEvangeline Parish: $43.50 an acreFranklin Parish: $78 an acreGrant Parish: combined into "other counties"Iberia Parish: $94 an acreIberville Parish: $31.50 an acreJackson Parish: $34.50 an acreJefferson Parish: combined into "other counties"Jefferson Davis Parish: $18 an acreLafayette Parish: $73.50 an acreLafourche Parish: $26 an acreLaSalle Parish: combined into "other counties"Lincoln Parish: $22 an acreLivingston Parish: combined into "other counties"Madison Parish: $143 an acreMorehouse Parish: $75 an acreNatchitoches Parish: $57.50 an acreOrleans Parish: combined into "other counties"Ouachita Parish: $84.50 an acrePlaquemines Parish: combined into "other counties"Pointe Coupee Parish: $84.50 an acreRapides Parish: $114 an acreRed River Parish: $77.50 an acreRichland Parish: $79.50 an acreSabine Parish: $20.50 an acreSt. Bernard Parish: combined into "other counties"St. Charles Parish: combined into "other counties"Saint Helena Parish: $24 an acreSaint James Parish: $62.50 an acreSt. John the Baptist Parish: combined into "other counties"Saint Landry Parish: $89 an acreSaint Martin Parish: $72.50 an acreSaint Mary Parish: $80.50 an acreSaint Tammany Parish: $14 an acreTangipahoa Parish: $37 an acreTensas Parish: $104 an acreTerrebonne Parish: combined into "other counties"Union Parish: $26.50 an acreVermilion Parish: $87 an acreVernon Parish: $20.50 an acreWashington Parish: $34.50 an acreWebster Parish: combined into "other counties"West Baton Rouge Parish: combined into "other counties"West Carroll Parish: $97.50 an acreWest Feliciana Parish: $19.50 an acreWinn Parish: combined into "other counties"
  • Under $40 (20 parishes)
  • $40 to under $80 (12 parishes)
  • $80 to under $120 (12 parishes)
  • $120 to under $160 (2 parishes)
  • $160 and over (0 parishes)
  • Not published separately (18 parishes, $47.50 an acre combined)

NASS combined Allen Parish, Ascension Parish, Assumption Parish, Bienville Parish, Cameron Parish, Grant Parish, Jefferson Parish, LaSalle Parish, Livingston Parish, Orleans Parish, Plaquemines Parish, St. Bernard Parish, St. Charles Parish, St. John the Baptist Parish, Terrebonne Parish, Webster Parish, West Baton Rouge Parish and Winn Parish into "other counties", so they have no figure of their own.

Published Louisiana parishes, highest first, 2026
Rank Parish Figure (dollars an acre) Precision (CV)
1 Madison Parish $143 6.5%
2 East Carroll Parish $130 6.0%
3 Concordia Parish $119 5.3%
4 Avoyelles Parish $115 12.0%
5 Rapides Parish $114 4.5%
6 Tensas Parish $104 6.5%
7 West Carroll Parish $97.50 17.4%
8 Iberia Parish $94 7.0%
9 Saint Landry Parish $89 10.8%
10 Catahoula Parish $88 10.1%
11 Vermilion Parish $87 5.4%
12 Ouachita Parish $84.50 6.6%
12 Pointe Coupee Parish $84.50 12.1%
14 Saint Mary Parish $80.50 4.3%
15 Richland Parish $79.50 20.2%
16 Franklin Parish $78 21.1%
17 Red River Parish $77.50 15.9%
18 Morehouse Parish $75 10.1%
19 Lafayette Parish $73.50 6.4%
20 Saint Martin Parish $72.50 5.3%
21 Caddo Parish $71 8.2%
22 Saint James Parish $62.50 9.7%
23 Natchitoches Parish $57.50 5.6%
24 Acadia Parish $53.50 5.7%
25 Caldwell Parish $48.50 3.6%
26 Evangeline Parish $43.50 6.3%
27 Bossier Parish $38 16.2%
28 Tangipahoa Parish $37 7.6%
29 Jackson Parish $34.50 6.5%
29 Washington Parish $34.50 7.7%
31 Iberville Parish $31.50 13.9%
32 De Soto Parish $29.50 7.2%
33 Union Parish $26.50 5.2%
34 Lafourche Parish $26 10.0%
35 Saint Helena Parish $24 8.2%
36 Beauregard Parish $22 6.7%
36 East Feliciana Parish $22 13.2%
36 Lincoln Parish $22 7.6%
39 Calcasieu Parish $20.50 9.9%
39 Sabine Parish $20.50 8.9%
39 Vernon Parish $20.50 2.2%
42 West Feliciana Parish $19.50 4.7%
43 Claiborne Parish $19 16.9%
44 East Baton Rouge Parish $18 6.4%
44 Jefferson Davis Parish $18 19.0%
46 Saint Tammany Parish $14 9.5%
Source: USDA National Agricultural Statistics Service (NASS), Cash Rents Survey. State and US estimates released Jul 31, 2026. Quick Stats item "RENT, CASH, CROPLAND, NON-IRRIGATED - EXPENSE, MEASURED IN $ / ACRE". Retrieved Oct 20, 2026; snapshot 2026-10-20.1. Dollars as published, not adjusted for inflation. This product uses the NASS API but is not endorsed or certified by NASS.

What this measures

NASS asks farm operators what they pay in cash rent per acre, separately for irrigated cropland, non-irrigated cropland and pasture. State figures come out at the end of July; county figures follow in August. When too few farms in a county answer, NASS combines that county with others and publishes one "other counties" figure, so some counties have no figure of their own.

Close this window.
Close this window.
Reconnecting…
One moment — we're restoring your session.