Cash rent for non-irrigated cropland: Somerset County, Maine
The average cash rent farmers paid per acre for non-irrigated cropland, from USDA's yearly cash rents survey.
The latest figures and how they have changed
 Chart by TallyTill · tallytill.com
What the numbers say
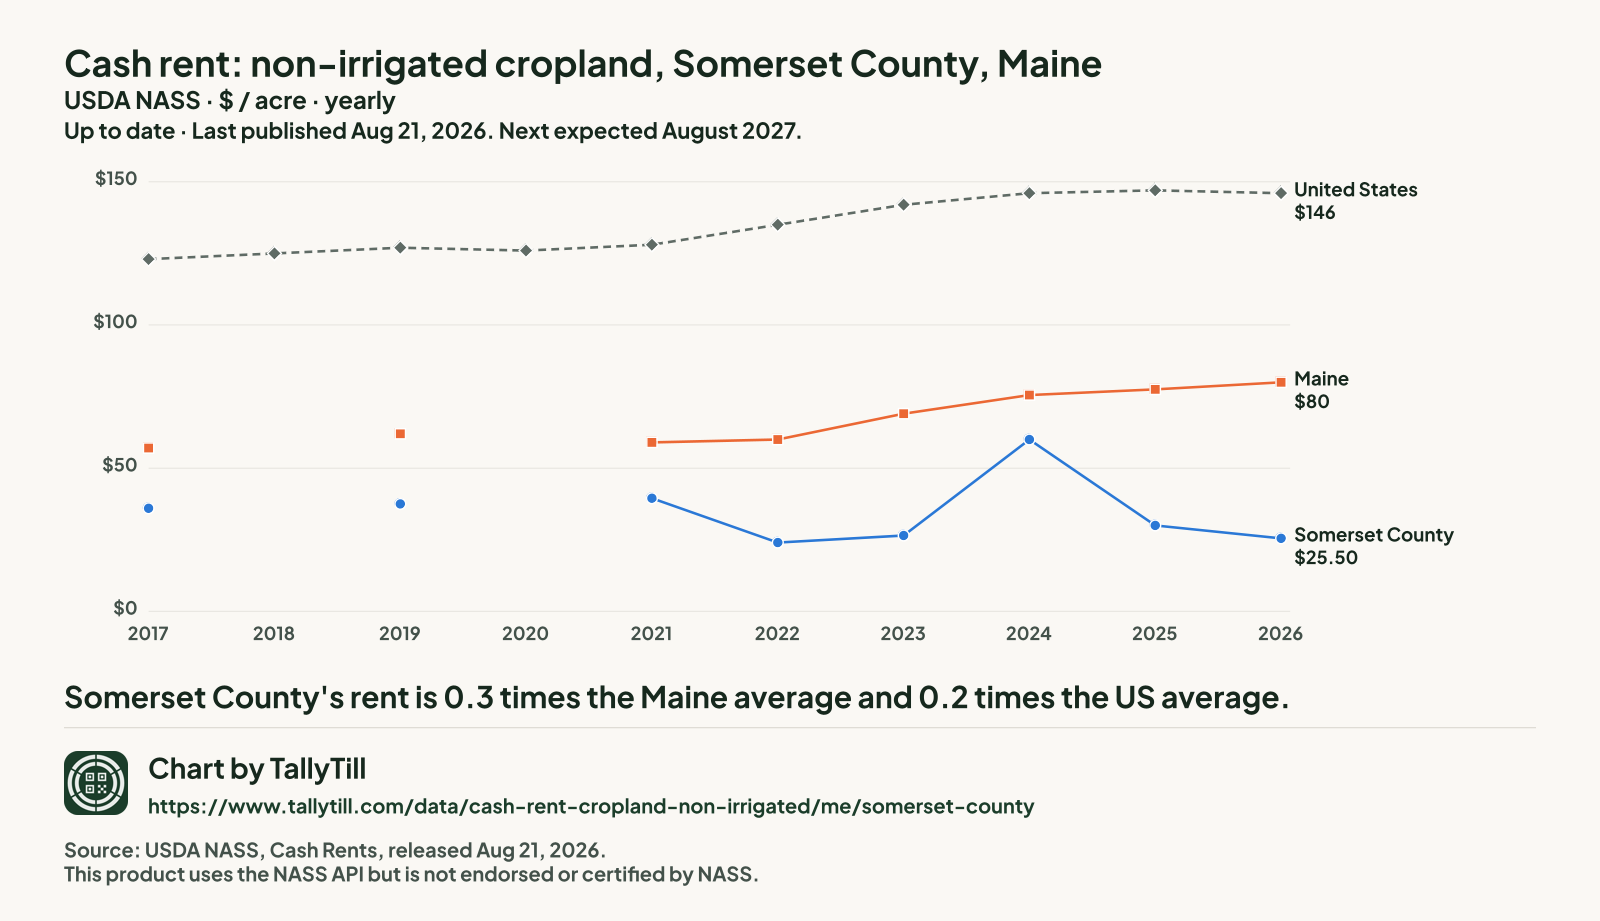
- Somerset County's rent is 0.3 times the Maine average and 0.2 times the US average.
- It is the 2nd lowest of the 10 Maine counties NASS published for 2026.
- Since 2017 it has fallen 29.2%, from $36 to $25.50 an acre.
- Gaps are years with no separate Somerset figure: NASS ran no county survey in 2018, and NASS had no figure available in 2020. Nothing is filled in.
Every figure behind this chart
| Year | Somerset County | Maine | United States |
|---|---|---|---|
| 2026 | $25.50 | $80 | $146 |
| 2025 | $30 | $77.50 | $147 |
| 2024 | $60 | $75.50 | $146 |
| 2023 | $26.50 | $69 | $142 |
| 2022 | $24 | $60 | $135 |
| 2021 | $39.50 | $59 | $128 |
| 2020 | Not available | No figure | $126 |
| 2019 | $37.50 | $62 | $127 |
| 2018 | No county survey that year | No figure | $125 |
| 2017 | $36 | $57 | $123 |
Every Maine county, 2026
Darker shading means a higher figure. Values run from $24 an acre in Oxford County to $108 an acre in Aroostook County.
- Under $40 (3 counties)
- $40 to under $80 (6 counties)
- $80 to under $120 (1 county)
- $120 to under $160 (0 counties)
- $160 and over (0 counties)
- Not published separately (6 counties, $56.50 an acre combined)
NASS combined Hancock County, Knox County, Lincoln County, Piscataquis County, Sagadahoc County and Washington County into "other counties", so they have no figure of their own.
| Rank | County | Figure (dollars an acre) | Precision (CV) |
|---|---|---|---|
| 1 | Aroostook County | $108 | 8.7% |
| 2 | Franklin County | $71.50 | 11.9% |
| 3 | Cumberland County | $66.50 | 9.6% |
| 4 | York County | $58 | 17.6% |
| 5 | Penobscot County | $52.50 | 30.9% |
| 6 | Kennebec County | $48.50 | 19.9% |
| 7 | Androscoggin County | $43.50 | 10.2% |
| 8 | Waldo County | $27.50 | 12.2% |
| 9 | Somerset County This county | $25.50 | 4.8% |
| 10 | Oxford County | $24 | 9.5% |
What this measures
NASS asks farm operators what they pay in cash rent per acre, separately for irrigated cropland, non-irrigated cropland and pasture. State figures come out at the end of July; county figures follow in August. When too few farms in a county answer, NASS combines that county with others and publishes one "other counties" figure, so some counties have no figure of their own.