Cash rent for non-irrigated cropland: Audrain County, Missouri
The average cash rent farmers paid per acre for non-irrigated cropland, from USDA's yearly cash rents survey.
The latest figures and how they have changed
 Chart by TallyTill · tallytill.com
What the numbers say
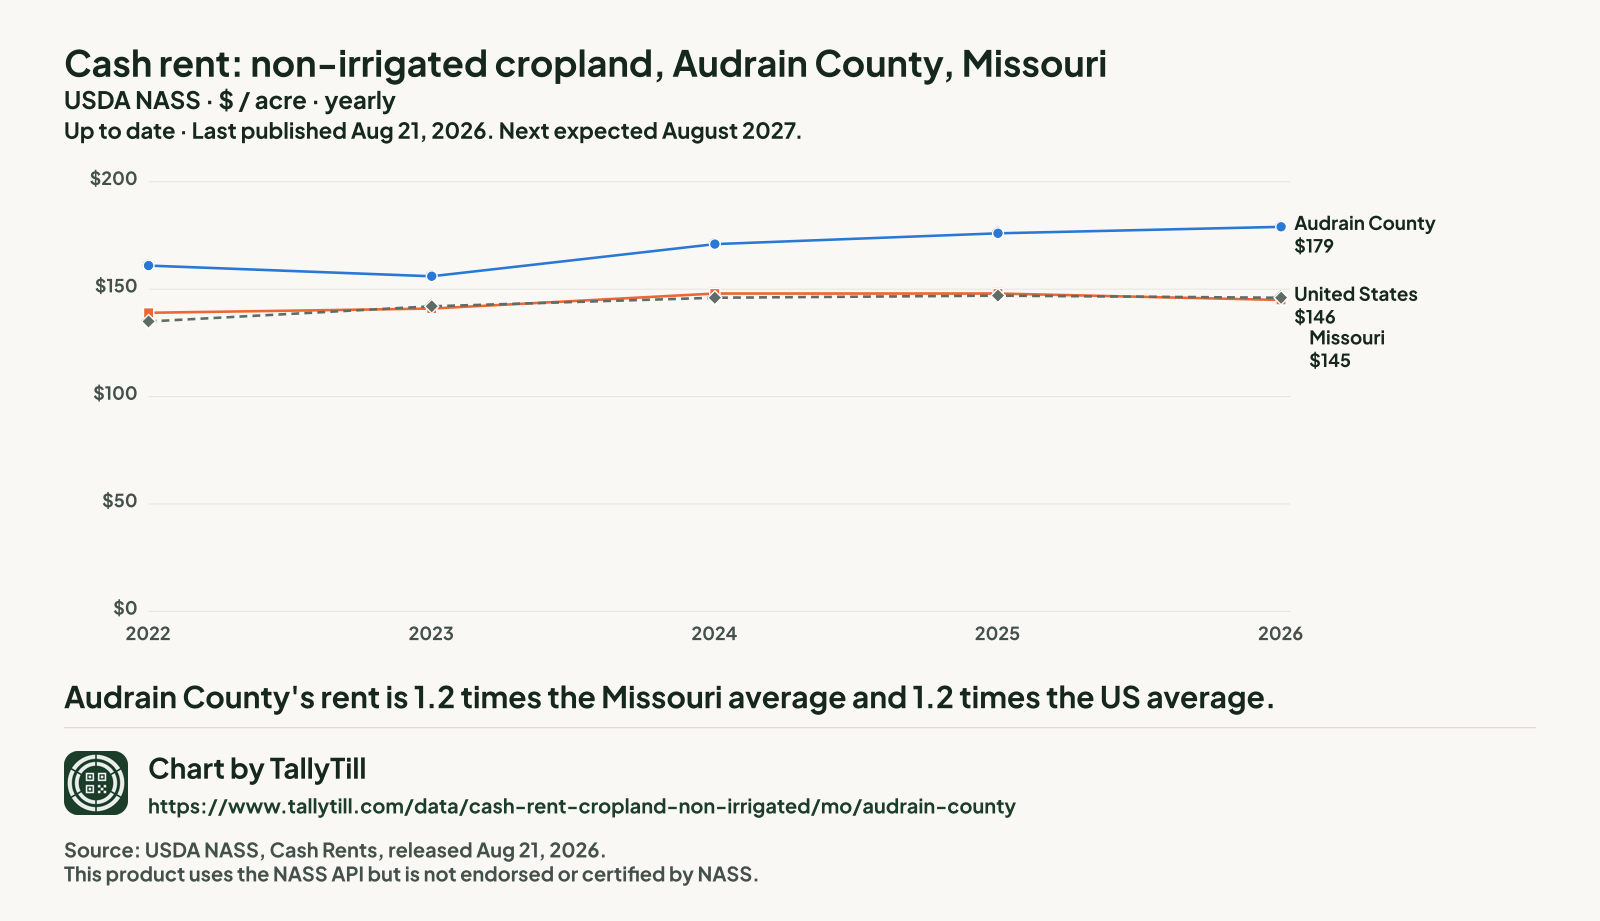
- Audrain County's rent is 1.2 times the Missouri average and 1.2 times the US average.
- It is the 13th highest of the 109 Missouri counties NASS published for 2026.
- Since 2022 it has risen 11.2%, from $161 to $179 an acre.
Every figure behind this chart
| Year | Audrain County | Missouri | United States |
|---|---|---|---|
| 2026 | $179 | $145 | $146 |
| 2025 | $176 | $148 | $147 |
| 2024 | $171 | $148 | $146 |
| 2023 | $156 | $141 | $142 |
| 2022 | $161 | $139 | $135 |
Every Missouri county, 2026
Darker shading means a higher figure. Values run from $16 an acre in Camden County to $247 an acre in Atchison County.
- Under $40 (16 counties)
- $40 to under $80 (25 counties)
- $80 to under $120 (16 counties)
- $120 to under $160 (24 counties)
- $160 and over (28 counties)
- Not published separately (6 counties, $33.50 an acre combined)
NASS combined Dunklin County, Iron County, Phelps County, Shannon County, St. Louis city and Stone County into "other counties", so they have no figure of their own.
| Rank | County | Figure (dollars an acre) | Precision (CV) |
|---|---|---|---|
| 1 | Atchison County | $247 | 2.3% |
| 2 | Lafayette County | $226 | 5.5% |
| 3 | Holt County | $217 | 8.2% |
| 4 | Clinton County | $200 | 5.6% |
| 5 | Saline County | $196 | 2.5% |
| 6 | Carroll County | $192 | 9.5% |
| 6 | Nodaway County | $192 | 5.5% |
| 8 | Worth County | $188 | 3.5% |
| 9 | Ray County | $187 | 3.2% |
| 10 | Livingston County | $185 | 7.0% |
| 10 | Marion County | $185 | 2.5% |
| 12 | Mississippi County | $183 | 5.0% |
| 13 | Audrain County This county | $179 | 3.6% |
| 14 | Shelby County | $177 | 3.6% |
| 15 | Lewis County | $176 | 3.3% |
| 15 | Scott County | $176 | 4.6% |
| 17 | Andrew County | $175 | 5.1% |
| 17 | Clay County | $175 | 5.6% |
| 17 | Daviess County | $175 | 4.1% |
| 17 | Scotland County | $175 | 4.2% |
| 21 | Knox County | $173 | 2.3% |
| 22 | Monroe County | $171 | 8.4% |
| 23 | Platte County | $168 | 10.8% |
| 24 | Grundy County | $165 | 3.7% |
| 24 | Ralls County | $165 | 3.7% |
| 26 | Buchanan County | $164 | 5.5% |
| 27 | New Madrid County | $161 | 2.6% |
| 28 | Gentry County | $160 | 3.2% |
| 29 | Caldwell County | $158 | 5.1% |
| 29 | Jackson County | $158 | 9.4% |
| 31 | Clark County | $157 | 2.5% |
| 31 | Pemiscot County | $157 | 2.7% |
| 31 | St Charles County | $157 | 3.5% |
| 34 | Chariton County | $156 | 9.7% |
| 34 | De Kalb County | $156 | 8.9% |
| 36 | Bates County | $155 | 11.0% |
| 37 | Lincoln County | $149 | 3.0% |
| 37 | Pettis County | $149 | 11.8% |
| 39 | Pike County | $148 | 5.5% |
| 40 | Cooper County | $144 | 6.6% |
| 40 | Randolph County | $144 | 5.0% |
| 42 | Boone County | $143 | 6.4% |
| 43 | Howard County | $142 | 5.8% |
| 43 | St Louis County | $142 | 6.7% |
| 45 | Mercer County | $139 | 10.0% |
| 46 | Harrison County | $136 | 4.4% |
| 47 | Macon County | $135 | 11.3% |
| 48 | Linn County | $134 | 6.2% |
| 49 | Callaway County | $131 | 4.9% |
| 50 | Cass County | $130 | 11.3% |
| 51 | Sullivan County | $123 | 9.8% |
| 52 | Adair County | $121 | 3.3% |
| 53 | Montgomery County | $119 | 4.6% |
| 54 | Putnam County | $118 | 13.4% |
| 55 | Cape Girardeau County | $117 | 3.5% |
| 56 | Perry County | $116 | 10.4% |
| 57 | Vernon County | $115 | 4.1% |
| 58 | Stoddard County | $113 | 3.0% |
| 59 | St Clair County | $109 | 3.6% |
| 60 | Warren County | $107 | 5.1% |
| 61 | Johnson County | $105 | 3.2% |
| 62 | Ste Genevieve County | $104 | 8.8% |
| 63 | Schuyler County | $97 | 3.7% |
| 64 | Henry County | $96.50 | 10.2% |
| 65 | Jasper County | $95.50 | 5.5% |
| 66 | Moniteau County | $84.50 | 5.5% |
| 67 | Cole County | $83.50 | 2.3% |
| 68 | Barton County | $83 | 3.2% |
| 69 | Benton County | $74.50 | 5.2% |
| 69 | Butler County | $74.50 | 7.7% |
| 71 | Ripley County | $74 | 14.4% |
| 72 | Franklin County | $70 | 13.4% |
| 73 | Osage County | $68.50 | 3.0% |
| 74 | Bollinger County | $68 | 7.3% |
| 74 | Lawrence County | $68 | 6.7% |
| 76 | Dade County | $66 | 6.5% |
| 77 | Morgan County | $64.50 | 4.2% |
| 78 | St Francois County | $63 | 5.4% |
| 79 | Newton County | $59.50 | 9.8% |
| 80 | Hickory County | $57.50 | 3.8% |
| 81 | Texas County | $56.50 | 21.9% |
| 82 | Miller County | $55 | 14.8% |
| 83 | Cedar County | $52.50 | 3.2% |
| 84 | Jefferson County | $52 | 8.8% |
| 85 | Greene County | $49.50 | 3.6% |
| 86 | Polk County | $47.50 | 3.8% |
| 87 | Howell County | $47 | 8.2% |
| 87 | Maries County | $47 | 4.7% |
| 89 | McDonald County | $46 | 3.6% |
| 90 | Christian County | $45.50 | 16.8% |
| 91 | Barry County | $45 | 2.8% |
| 92 | Reynolds County | $42.50 | 19.4% |
| 93 | Wayne County | $41.50 | 2.7% |
| 94 | Laclede County | $38.50 | 8.4% |
| 95 | Gasconade County | $38 | 3.9% |
| 96 | Webster County | $37 | 3.8% |
| 97 | Madison County | $35.50 | 9.8% |
| 98 | Wright County | $34.50 | 6.9% |
| 99 | Dallas County | $31.50 | 3.6% |
| 99 | Douglas County | $31.50 | 17.7% |
| 99 | Ozark County | $31.50 | 6.5% |
| 102 | Pulaski County | $29 | 4.0% |
| 103 | Oregon County | $27.50 | 4.6% |
| 104 | Crawford County | $24.50 | 9.6% |
| 105 | Taney County | $24 | 3.9% |
| 106 | Washington County | $22 | 6.1% |
| 107 | Dent County | $20 | 4.1% |
| 108 | Carter County | $19 | 5.3% |
| 109 | Camden County | $16 | 5.2% |
What this measures
NASS asks farm operators what they pay in cash rent per acre, separately for irrigated cropland, non-irrigated cropland and pasture. State figures come out at the end of July; county figures follow in August. When too few farms in a county answer, NASS combines that county with others and publishes one "other counties" figure, so some counties have no figure of their own.