Cash rent for non-irrigated cropland: Meagher County, Montana
The average cash rent farmers paid per acre for non-irrigated cropland, from USDA's yearly cash rents survey.
The latest figures and how they have changed
 Chart by TallyTill · tallytill.com
What the numbers say
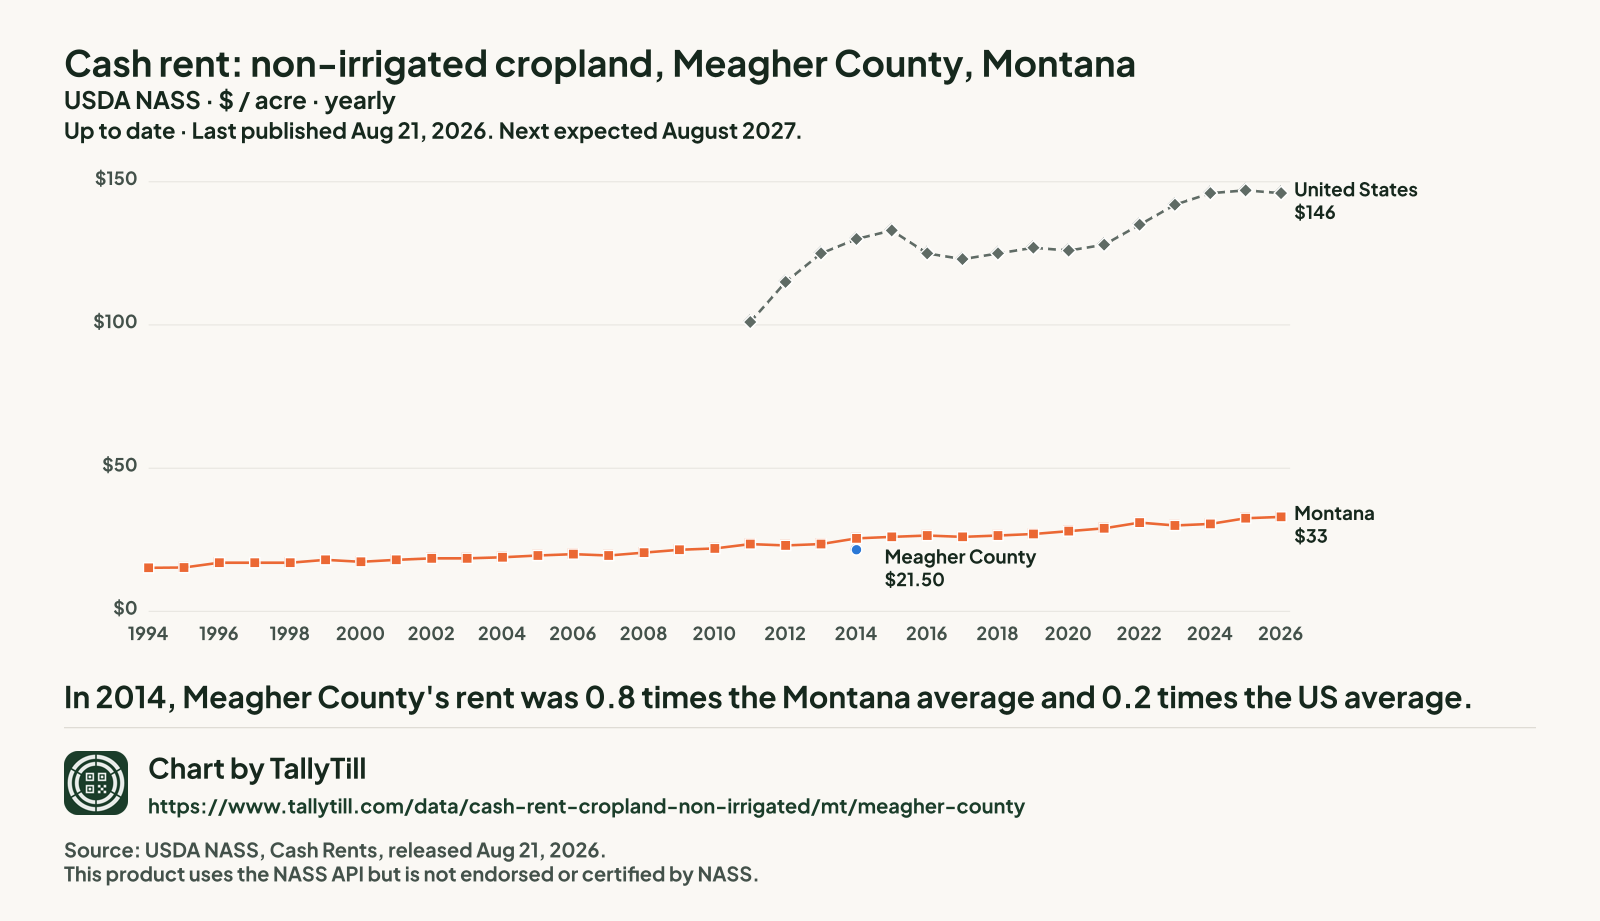
- In 2014, Meagher County's rent was 0.8 times the Montana average and 0.2 times the US average.
- It is tied for the 14th lowest of the 34 Montana counties NASS published for 2014.
- Gaps are years with no separate Meagher figure: NASS ran no county survey in 2015 or 2018, in 2009, 2010, 2011, 2012, 2013, 2016, 2017, 2019, 2020, 2021, 2022, 2023, 2024, 2025 and 2026 it combined Meagher into "other counties", and NASS had no figure available in 2008. Nothing is filled in.
Every figure behind this chart
| Year | Meagher County | Montana | United States |
|---|---|---|---|
| 2026 | Combined into "other counties" | $33 | $146 |
| 2025 | Combined into "other counties" | $32.50 | $147 |
| 2024 | Combined into "other counties" | $30.50 | $146 |
| 2023 | Combined into "other counties" | $30 | $142 |
| 2022 | Combined into "other counties" | $31 | $135 |
| 2021 | Combined into "other counties" | $29 | $128 |
| 2020 | Combined into "other counties" | $28 | $126 |
| 2019 | Combined into "other counties" | $27 | $127 |
| 2018 | No county survey that year | $26.50 | $125 |
| 2017 | Combined into "other counties" | $26 | $123 |
| 2016 | Combined into "other counties" | $26.50 | $125 |
| 2015 | No county survey that year | $26 | $133 |
| 2014 | $21.50 | $25.50 | $130 |
| 2013 | Combined into "other counties" | $23.50 | $125 |
| 2012 | Combined into "other counties" | $23 | $115 |
| 2011 | Combined into "other counties" | $23.50 | $101 |
| 2010 | Combined into "other counties" | $22 | No figure |
| 2009 | Combined into "other counties" | $21.50 | No figure |
| 2008 | Not available | $20.50 | No figure |
| 2007 | No figure | $19.50 | No figure |
| 2006 | No figure | $20 | No figure |
| 2005 | No figure | $19.50 | No figure |
| 2004 | No figure | $18.90 | No figure |
| 2003 | No figure | $18.50 | No figure |
| 2002 | No figure | $18.50 | No figure |
| 2001 | No figure | $18 | No figure |
| 2000 | No figure | $17.30 | No figure |
| 1999 | No figure | $18 | No figure |
| 1998 | No figure | $17 | No figure |
| 1997 | No figure | $17 | No figure |
| 1996 | No figure | $17 | No figure |
| 1995 | No figure | $15.30 | No figure |
| 1994 | No figure | $15.20 | No figure |
Every Montana county, 2026
Darker shading means a higher figure. Values run from $18.50 an acre in Beaverhead County to $45.50 an acre in Cascade County.
- Under $26.50 (8 counties)
- $26.50 to under $29 (6 counties)
- $29 to under $32.50 (8 counties)
- $32.50 to under $38.50 (10 counties)
- $38.50 and over (8 counties)
- Not published separately (16 counties, $24.50 an acre combined)
NASS combined Broadwater County, Custer County, Deer Lodge County, Granite County, Lewis and Clark County, Lincoln County, Madison County, Meagher County, Mineral County, Missoula County, Petroleum County, Powder River County, Powell County, Silver Bow County, Sweet Grass County and Treasure County into "other counties", so they have no figure of their own.
Meagher: not published separately.
| Rank | County | Figure (dollars an acre) | Precision (CV) |
|---|---|---|---|
| 1 | Cascade County | $45.50 | 5.5% |
| 2 | Pondera County | $44 | 4.1% |
| 3 | Flathead County | $42.50 | 5.1% |
| 3 | Lake County | $42.50 | 4.8% |
| 3 | Sheridan County | $42.50 | 2.7% |
| 6 | Teton County | $42 | 14.5% |
| 7 | Gallatin County | $39 | 6.7% |
| 8 | Prairie County | $38.50 | 3.8% |
| 9 | Chouteau County | $36.50 | 4.1% |
| 10 | Dawson County | $35.50 | 3.7% |
| 10 | Ravalli County | $35.50 | 9.6% |
| 12 | Fergus County | $34.50 | 3.7% |
| 13 | Judith Basin County | $34 | 6.4% |
| 14 | Daniels County | $33 | 3.3% |
| 14 | Richland County | $33 | 6.6% |
| 16 | Carbon County | $32.50 | 8.8% |
| 16 | Park County | $32.50 | 2.5% |
| 16 | Wibaux County | $32.50 | 10.4% |
| 19 | Hill County | $30.50 | 5.0% |
| 19 | Phillips County | $30.50 | 15.1% |
| 19 | Toole County | $30.50 | 12.0% |
| 22 | Roosevelt County | $30 | 5.8% |
| 23 | Liberty County | $29.50 | 3.5% |
| 24 | Blaine County | $29 | 4.4% |
| 24 | Garfield County | $29 | 3.8% |
| 24 | Glacier County | $29 | 3.9% |
| 27 | Golden Valley County | $28.50 | 2.8% |
| 28 | Big Horn County | $27.50 | 6.3% |
| 28 | Yellowstone County | $27.50 | 5.7% |
| 30 | McCone County | $27 | 6.3% |
| 30 | Valley County | $27 | 6.5% |
| 32 | Fallon County | $26.50 | 5.3% |
| 33 | Rosebud County | $25 | 3.5% |
| 34 | Musselshell County | $23 | 6.1% |
| 35 | Jefferson County | $22.50 | 3.5% |
| 36 | Carter County | $21.50 | 21.4% |
| 36 | Sanders County | $21.50 | 8.5% |
| 36 | Wheatland County | $21.50 | 12.2% |
| 39 | Stillwater County | $20 | 4.7% |
| 40 | Beaverhead County | $18.50 | 14.5% |
What this measures
NASS asks farm operators what they pay in cash rent per acre, separately for irrigated cropland, non-irrigated cropland and pasture. State figures come out at the end of July; county figures follow in August. When too few farms in a county answer, NASS combines that county with others and publishes one "other counties" figure, so some counties have no figure of their own.