Cash rent for non-irrigated cropland: Nebraska
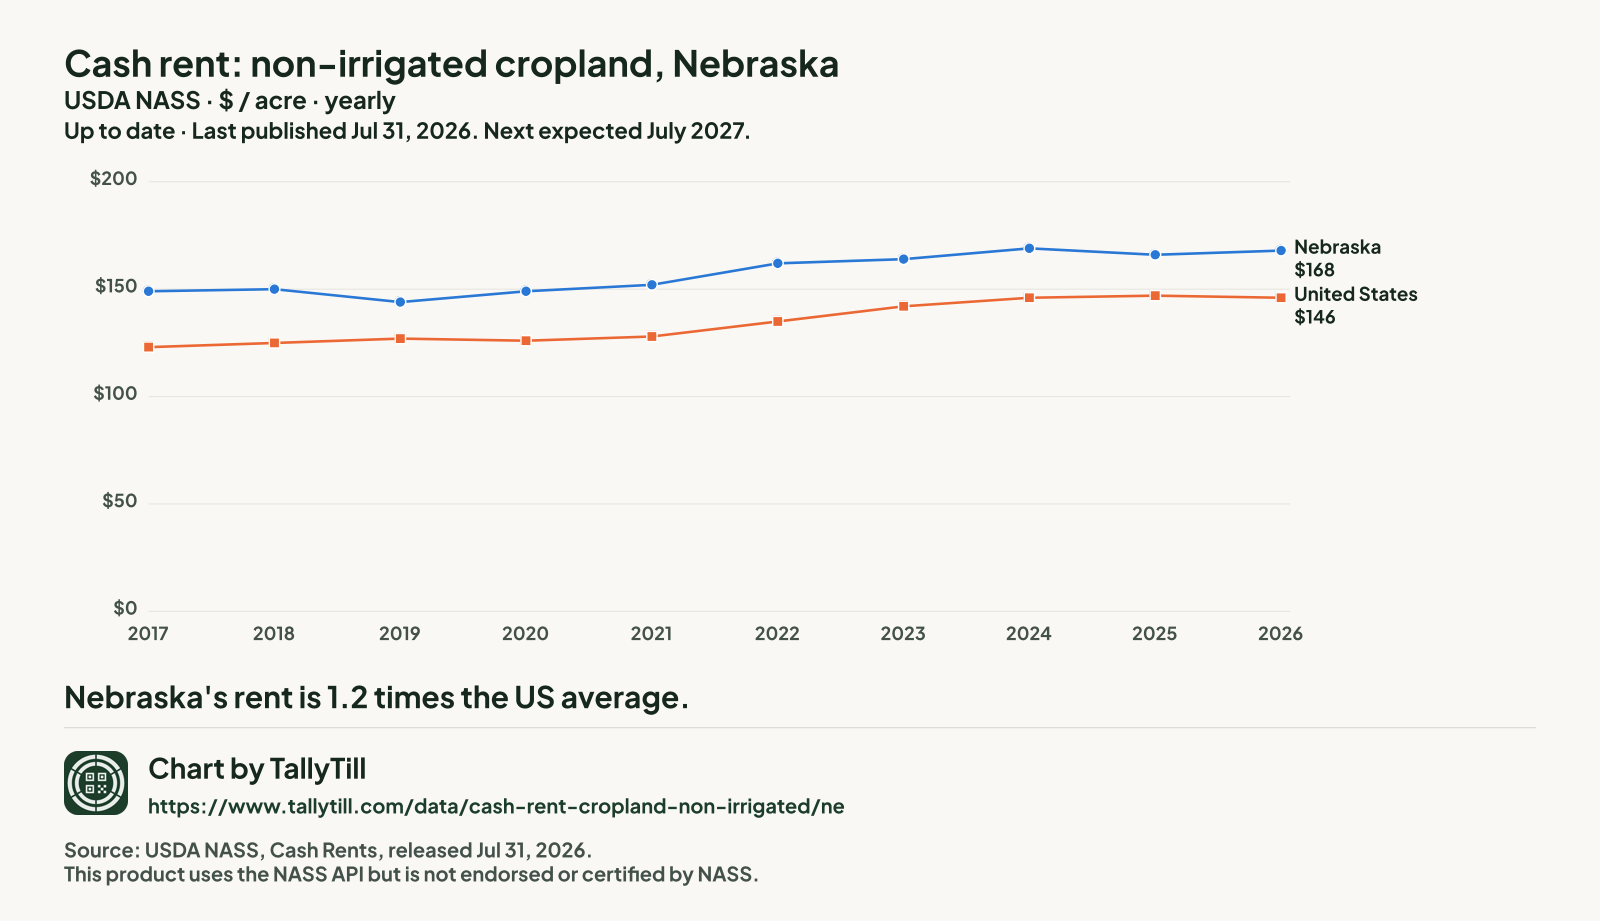
The average cash rent farmers paid per acre for non-irrigated cropland, from USDA's yearly cash rents survey.
The latest figures and how they have changed
 Chart by TallyTill · tallytill.com
What the numbers say
- Nebraska's rent is 1.2 times the US average.
- Since 2017 it has risen 12.8%, from $149 to $168 an acre.
Every figure behind this chart
| Year | Nebraska | United States |
|---|---|---|
| 2026 | $168 | $146 |
| 2025 | $166 | $147 |
| 2024 | $169 | $146 |
| 2023 | $164 | $142 |
| 2022 | $162 | $135 |
| 2021 | $152 | $128 |
| 2020 | $149 | $126 |
| 2019 | $144 | $127 |
| 2018 | $150 | $125 |
| 2017 | $149 | $123 |
Every Nebraska county, 2026
Darker shading means a higher figure. Values run from $23.50 an acre in Sioux County to $289 an acre in Cuming County.
- Under $40 (6 counties)
- $40 to under $80 (15 counties)
- $80 to under $120 (10 counties)
- $120 to under $160 (15 counties)
- $160 and over (34 counties)
- Not published separately (13 counties, $61.50 an acre combined)
NASS combined Arthur County, Blaine County, Brown County, Cherry County, Grant County, Hall County, Hooker County, McPherson County, Merrick County, Morrill County, Scotts Bluff County, Thomas County and York County into "other counties", so they have no figure of their own.
| Rank | County | Figure (dollars an acre) | Precision (CV) |
|---|---|---|---|
| 1 | Cuming County | $289 | 3.4% |
| 2 | Thurston County | $269 | 3.7% |
| 2 | Wayne County | $269 | 4.9% |
| 4 | Dakota County | $264 | 3.8% |
| 5 | Platte County | $258 | 5.6% |
| 6 | Dixon County | $256 | 2.5% |
| 7 | Burt County | $252 | 1.9% |
| 7 | Stanton County | $252 | 4.1% |
| 9 | Colfax County | $249 | 2.6% |
| 10 | Douglas County | $248 | 1.9% |
| 11 | Cedar County | $247 | 3.2% |
| 12 | Washington County | $229 | 4.3% |
| 13 | Butler County | $226 | 3.5% |
| 13 | Cass County | $226 | 4.0% |
| 15 | Dodge County | $225 | 3.0% |
| 16 | Sarpy County | $223 | 3.7% |
| 16 | Saunders County | $223 | 3.3% |
| 18 | Knox County | $217 | 2.7% |
| 19 | Madison County | $214 | 4.3% |
| 20 | Nemaha County | $213 | 3.2% |
| 21 | Richardson County | $211 | 3.2% |
| 22 | Seward County | $205 | 3.7% |
| 23 | Boone County | $204 | 4.0% |
| 23 | Nance County | $204 | 5.8% |
| 25 | Pierce County | $197 | 5.4% |
| 26 | Lancaster County | $190 | 3.7% |
| 27 | Polk County | $187 | 4.3% |
| 28 | Otoe County | $186 | 3.1% |
| 29 | Johnson County | $184 | 3.3% |
| 30 | Gage County | $176 | 2.8% |
| 30 | Pawnee County | $176 | 4.7% |
| 32 | Fillmore County | $174 | 3.4% |
| 32 | Hamilton County | $174 | 11.2% |
| 34 | Antelope County | $173 | 3.5% |
| 35 | Jefferson County | $159 | 2.7% |
| 36 | Clay County | $157 | 3.5% |
| 37 | Saline County | $152 | 4.0% |
| 38 | Nuckolls County | $148 | 3.0% |
| 39 | Greeley County | $145 | 10.7% |
| 40 | Adams County | $144 | 8.1% |
| 41 | Buffalo County | $138 | 3.7% |
| 42 | Phelps County | $135 | 3.9% |
| 43 | Sherman County | $134 | 3.4% |
| 44 | Howard County | $132 | 2.6% |
| 44 | Thayer County | $132 | 5.5% |
| 44 | Valley County | $132 | 6.8% |
| 47 | Kearney County | $129 | 5.3% |
| 48 | Dawson County | $128 | 4.0% |
| 49 | Boyd County | $126 | 4.3% |
| 50 | Harlan County | $117 | 3.5% |
| 50 | Webster County | $117 | 3.8% |
| 52 | Franklin County | $115 | 3.9% |
| 53 | Loup County | $110 | 27.6% |
| 54 | Custer County | $99.50 | 3.9% |
| 55 | Gosper County | $98 | 13.9% |
| 56 | Garfield County | $89.50 | 6.3% |
| 56 | Holt County | $89.50 | 5.6% |
| 58 | Furnas County | $87.50 | 3.4% |
| 58 | Wheeler County | $87.50 | 2.7% |
| 60 | Frontier County | $67.50 | 6.3% |
| 61 | Red Willow County | $66.50 | 3.8% |
| 62 | Lincoln County | $66 | 3.7% |
| 63 | Hayes County | $61.50 | 3.5% |
| 64 | Hitchcock County | $60 | 5.1% |
| 65 | Chase County | $58 | 6.7% |
| 66 | Keith County | $56 | 4.2% |
| 67 | Perkins County | $54 | 3.1% |
| 68 | Dundy County | $51 | 3.6% |
| 69 | Logan County | $49 | 4.2% |
| 70 | Rock County | $47.50 | 5.0% |
| 71 | Deuel County | $44.50 | 5.2% |
| 72 | Garden County | $44 | 5.7% |
| 73 | Keya Paha County | $43 | 5.6% |
| 74 | Cheyenne County | $42.50 | 4.0% |
| 75 | Box Butte County | $38 | 11.2% |
| 76 | Sheridan County | $36 | 4.3% |
| 77 | Dawes County | $34.50 | 5.8% |
| 77 | Kimball County | $34.50 | 5.0% |
| 79 | Banner County | $30.50 | 8.4% |
| 80 | Sioux County | $23.50 | 2.0% |
What this measures
NASS asks farm operators what they pay in cash rent per acre, separately for irrigated cropland, non-irrigated cropland and pasture. State figures come out at the end of July; county figures follow in August. When too few farms in a county answer, NASS combines that county with others and publishes one "other counties" figure, so some counties have no figure of their own.