Cash rent for non-irrigated cropland: Hardin County, Ohio
The average cash rent farmers paid per acre for non-irrigated cropland, from USDA's yearly cash rents survey.
The latest figures and how they have changed
 Chart by TallyTill · tallytill.com
What the numbers say
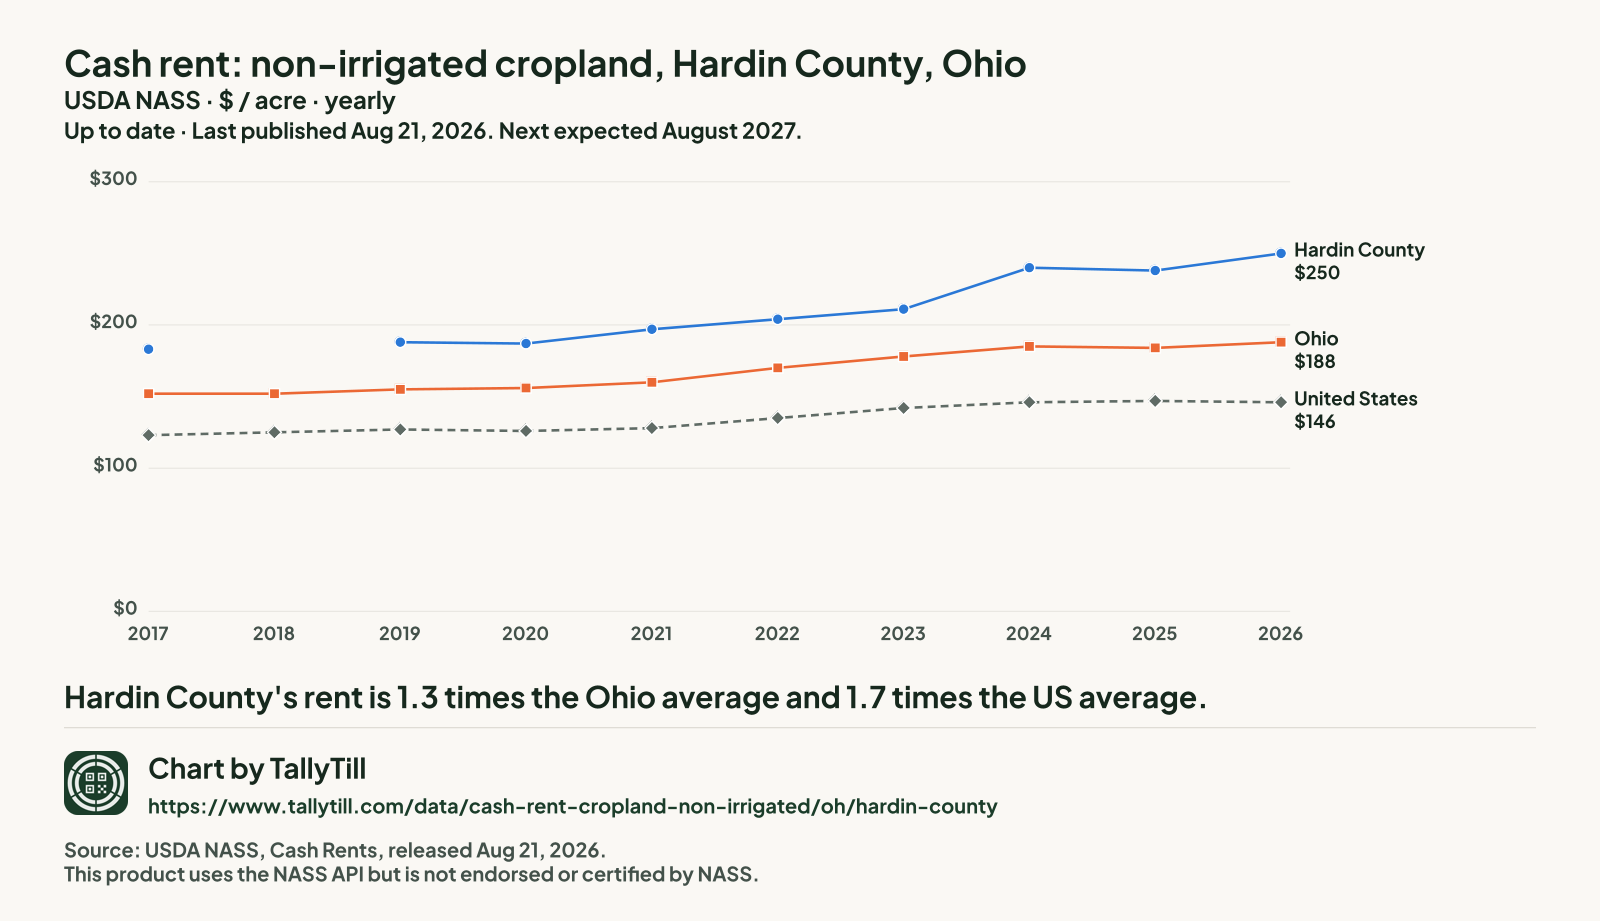
- Hardin County's rent is 1.3 times the Ohio average and 1.7 times the US average.
- It is the 2nd highest of the 76 Ohio counties NASS published for 2026.
- Since 2017 it has risen 36.6%, from $183 to $250 an acre.
- Gaps are years with no separate Hardin figure: NASS ran no county survey in 2018. Nothing is filled in.
Every figure behind this chart
| Year | Hardin County | Ohio | United States |
|---|---|---|---|
| 2026 | $250 | $188 | $146 |
| 2025 | $238 | $184 | $147 |
| 2024 | $240 | $185 | $146 |
| 2023 | $211 | $178 | $142 |
| 2022 | $204 | $170 | $135 |
| 2021 | $197 | $160 | $128 |
| 2020 | $187 | $156 | $126 |
| 2019 | $188 | $155 | $127 |
| 2018 | No county survey that year | $152 | $125 |
| 2017 | $183 | $152 | $123 |
Every Ohio county, 2026
Darker shading means a higher figure. Values run from $26.50 an acre in Belmont County to $256 an acre in Shelby County.
- Under $40 (1 county)
- $40 to under $80 (13 counties)
- $80 to under $120 (10 counties)
- $120 to under $160 (11 counties)
- $160 and over (41 counties)
- Not published separately (12 counties, $209 an acre combined)
NASS combined Cuyahoga County, Darke County, Hamilton County, Henry County, Hocking County, Knox County, Lake County, Meigs County, Mercer County, Monroe County, Putnam County and Vinton County into "other counties", so they have no figure of their own.
| Rank | County | Figure (dollars an acre) | Precision (CV) |
|---|---|---|---|
| 1 | Shelby County | $256 | 3.2% |
| 2 | Hardin County This county | $250 | 3.0% |
| 3 | Clark County | $247 | 4.0% |
| 4 | Fayette County | $240 | 4.4% |
| 5 | Madison County | $237 | 5.8% |
| 6 | Auglaize County | $234 | 3.7% |
| 7 | Preble County | $232 | 3.6% |
| 8 | Allen County | $226 | 4.6% |
| 8 | Fulton County | $226 | 3.3% |
| 8 | Greene County | $226 | 4.3% |
| 11 | Van Wert County | $225 | 3.0% |
| 12 | Franklin County | $218 | 3.5% |
| 12 | Pickaway County | $218 | 2.8% |
| 14 | Champaign County | $217 | 4.4% |
| 14 | Wyandot County | $217 | 6.4% |
| 16 | Montgomery County | $215 | 5.8% |
| 17 | Hancock County | $212 | 3.0% |
| 17 | Miami County | $212 | 3.0% |
| 19 | Crawford County | $209 | 1.6% |
| 20 | Wood County | $208 | 2.3% |
| 21 | Williams County | $206 | 4.4% |
| 22 | Logan County | $202 | 4.0% |
| 23 | Sandusky County | $201 | 3.0% |
| 24 | Marion County | $195 | 5.5% |
| 25 | Union County | $194 | 7.2% |
| 26 | Morrow County | $193 | 6.0% |
| 27 | Erie County | $191 | 4.0% |
| 28 | Delaware County | $190 | 3.8% |
| 29 | Paulding County | $189 | 2.7% |
| 30 | Fairfield County | $188 | 3.5% |
| 31 | Huron County | $187 | 3.9% |
| 32 | Ottawa County | $183 | 3.1% |
| 33 | Seneca County | $178 | 3.4% |
| 34 | Defiance County | $177 | 5.8% |
| 35 | Lucas County | $175 | 6.6% |
| 36 | Ross County | $174 | 4.7% |
| 37 | Highland County | $173 | 5.9% |
| 38 | Clinton County | $170 | 5.0% |
| 39 | Butler County | $165 | 5.4% |
| 39 | Richland County | $165 | 6.1% |
| 41 | Brown County | $161 | 3.0% |
| 42 | Licking County | $155 | 6.7% |
| 43 | Wayne County | $154 | 2.9% |
| 44 | Pike County | $147 | 12.3% |
| 45 | Warren County | $140 | 2.7% |
| 46 | Lorain County | $137 | 6.2% |
| 47 | Adams County | $136 | 5.1% |
| 48 | Ashland County | $129 | 7.0% |
| 48 | Clermont County | $129 | 11.4% |
| 50 | Holmes County | $127 | 5.9% |
| 51 | Muskingum County | $120 | 16.6% |
| 51 | Tuscarawas County | $120 | 14.6% |
| 53 | Scioto County | $107 | 9.3% |
| 54 | Perry County | $103 | 4.2% |
| 55 | Mahoning County | $102 | 6.0% |
| 56 | Medina County | $99.50 | 5.1% |
| 57 | Coshocton County | $95 | 4.1% |
| 58 | Columbiana County | $94 | 6.8% |
| 59 | Stark County | $87.50 | 5.0% |
| 60 | Trumbull County | $82.50 | 5.6% |
| 61 | Portage County | $81.50 | 5.2% |
| 62 | Summit County | $80 | 4.7% |
| 63 | Jackson County | $74 | 9.8% |
| 64 | Geauga County | $65.50 | 6.4% |
| 65 | Washington County | $65 | 5.9% |
| 66 | Carroll County | $64.50 | 11.9% |
| 67 | Gallia County | $62.50 | 8.5% |
| 68 | Guernsey County | $56 | 7.0% |
| 68 | Morgan County | $56 | 10.1% |
| 70 | Athens County | $55 | 3.1% |
| 71 | Ashtabula County | $53 | 10.6% |
| 72 | Harrison County | $50.50 | 13.1% |
| 72 | Lawrence County | $50.50 | 6.5% |
| 74 | Noble County | $47.50 | 5.8% |
| 75 | Jefferson County | $45.50 | 25.1% |
| 76 | Belmont County | $26.50 | 11.5% |
What this measures
NASS asks farm operators what they pay in cash rent per acre, separately for irrigated cropland, non-irrigated cropland and pasture. State figures come out at the end of July; county figures follow in August. When too few farms in a county answer, NASS combines that county with others and publishes one "other counties" figure, so some counties have no figure of their own.