Cash rent for non-irrigated cropland: Hampton County, South Carolina
The average cash rent farmers paid per acre for non-irrigated cropland, from USDA's yearly cash rents survey.
The latest figures and how they have changed
 Chart by TallyTill · tallytill.com
What the numbers say
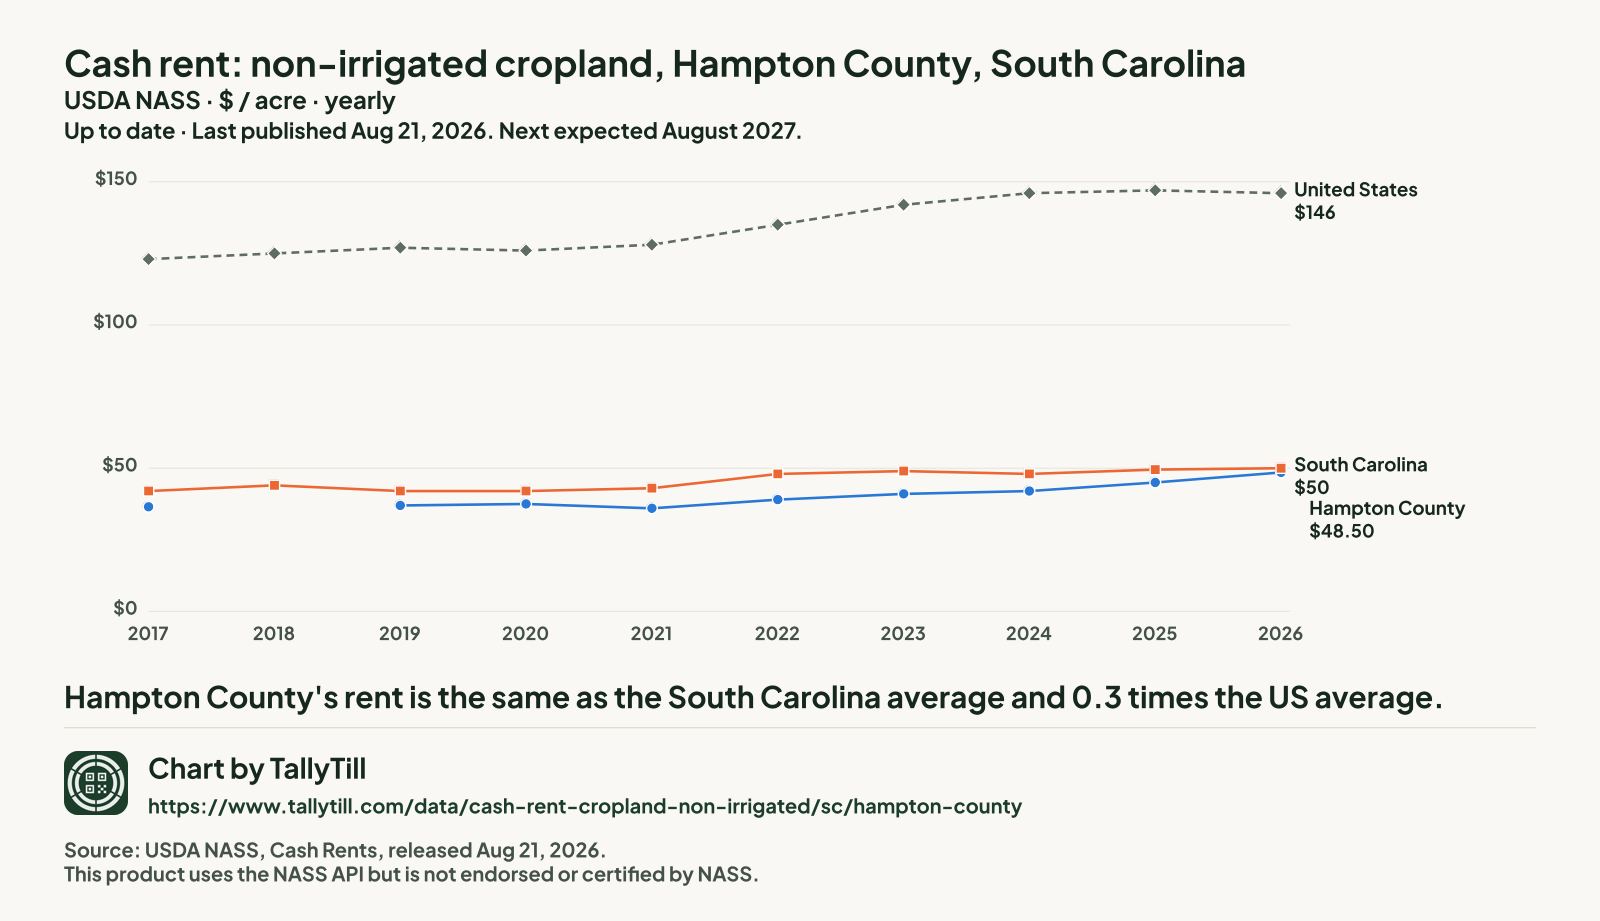
- Hampton County's rent is the same as the South Carolina average and 0.3 times the US average.
- It is the 10th highest of the 38 South Carolina counties NASS published for 2026.
- Since 2017 it has risen 32.9%, from $36.50 to $48.50 an acre.
- Gaps are years with no separate Hampton figure: NASS ran no county survey in 2018. Nothing is filled in.
Every figure behind this chart
| Year | Hampton County | South Carolina | United States |
|---|---|---|---|
| 2026 | $48.50 | $50 | $146 |
| 2025 | $45 | $49.50 | $147 |
| 2024 | $42 | $48 | $146 |
| 2023 | $41 | $49 | $142 |
| 2022 | $39 | $48 | $135 |
| 2021 | $36 | $43 | $128 |
| 2020 | $37.50 | $42 | $126 |
| 2019 | $37 | $42 | $127 |
| 2018 | No county survey that year | $44 | $125 |
| 2017 | $36.50 | $42 | $123 |
Every South Carolina county, 2026
Darker shading means a higher figure. Values run from $15 an acre in Greenwood County to $74.50 an acre in Horry County.
- Under $26.50 (6 counties)
- $26.50 to under $33.50 (8 counties)
- $33.50 to under $42.50 (8 counties)
- $42.50 to under $49.50 (7 counties)
- $49.50 and over (9 counties)
- Not published separately (8 counties, $46.50 an acre combined)
NASS combined Beaufort County, Charleston County, Edgefield County, Fairfield County, Jasper County, Kershaw County, McCormick County and Newberry County into "other counties", so they have no figure of their own.
| Rank | County | Figure (dollars an acre) | Precision (CV) |
|---|---|---|---|
| 1 | Horry County | $74.50 | 3.1% |
| 2 | Marion County | $64 | 6.3% |
| 3 | Dillon County | $60.50 | 3.9% |
| 4 | Marlboro County | $60 | 3.9% |
| 5 | Calhoun County | $54 | 4.5% |
| 6 | Clarendon County | $53.50 | 2.5% |
| 7 | Lee County | $52 | 3.4% |
| 8 | Orangeburg County | $49.50 | 4.0% |
| 8 | Sumter County | $49.50 | 4.6% |
| 10 | Hampton County This county | $48.50 | 4.9% |
| 11 | Chesterfield County | $47.50 | 6.5% |
| 12 | Darlington County | $47 | 3.9% |
| 12 | Florence County | $47 | 2.2% |
| 14 | Dorchester County | $45 | 4.2% |
| 15 | Barnwell County | $44 | 5.7% |
| 16 | Colleton County | $42.50 | 6.1% |
| 17 | Richland County | $42 | 3.0% |
| 18 | Aiken County | $40.50 | 5.4% |
| 19 | Williamsburg County | $40 | 3.4% |
| 20 | Georgetown County | $39 | 3.4% |
| 21 | Bamberg County | $38.50 | 6.5% |
| 22 | Allendale County | $37.50 | 5.5% |
| 23 | Lancaster County | $33.50 | 18.9% |
| 23 | York County | $33.50 | 19.1% |
| 25 | Lexington County | $33 | 8.4% |
| 25 | Saluda County | $33 | 4.9% |
| 27 | Oconee County | $32.50 | 8.3% |
| 28 | Pickens County | $29 | 5.1% |
| 29 | Cherokee County | $28.50 | 5.2% |
| 30 | Greenville County | $28 | 14.8% |
| 31 | Berkeley County | $26.50 | 7.7% |
| 31 | Spartanburg County | $26.50 | 5.0% |
| 33 | Anderson County | $24 | 14.1% |
| 34 | Chester County | $22 | 6.6% |
| 35 | Abbeville County | $20.50 | 18.0% |
| 36 | Laurens County | $20 | 3.8% |
| 37 | Greenwood County | $15 | 3.9% |
| 37 | Union County | $15 | 9.0% |
What this measures
NASS asks farm operators what they pay in cash rent per acre, separately for irrigated cropland, non-irrigated cropland and pasture. State figures come out at the end of July; county figures follow in August. When too few farms in a county answer, NASS combines that county with others and publishes one "other counties" figure, so some counties have no figure of their own.