Cash rent for non-irrigated cropland: Hickman County, Tennessee
The average cash rent farmers paid per acre for non-irrigated cropland, from USDA's yearly cash rents survey.
The latest figures and how they have changed
 Chart by TallyTill · tallytill.com
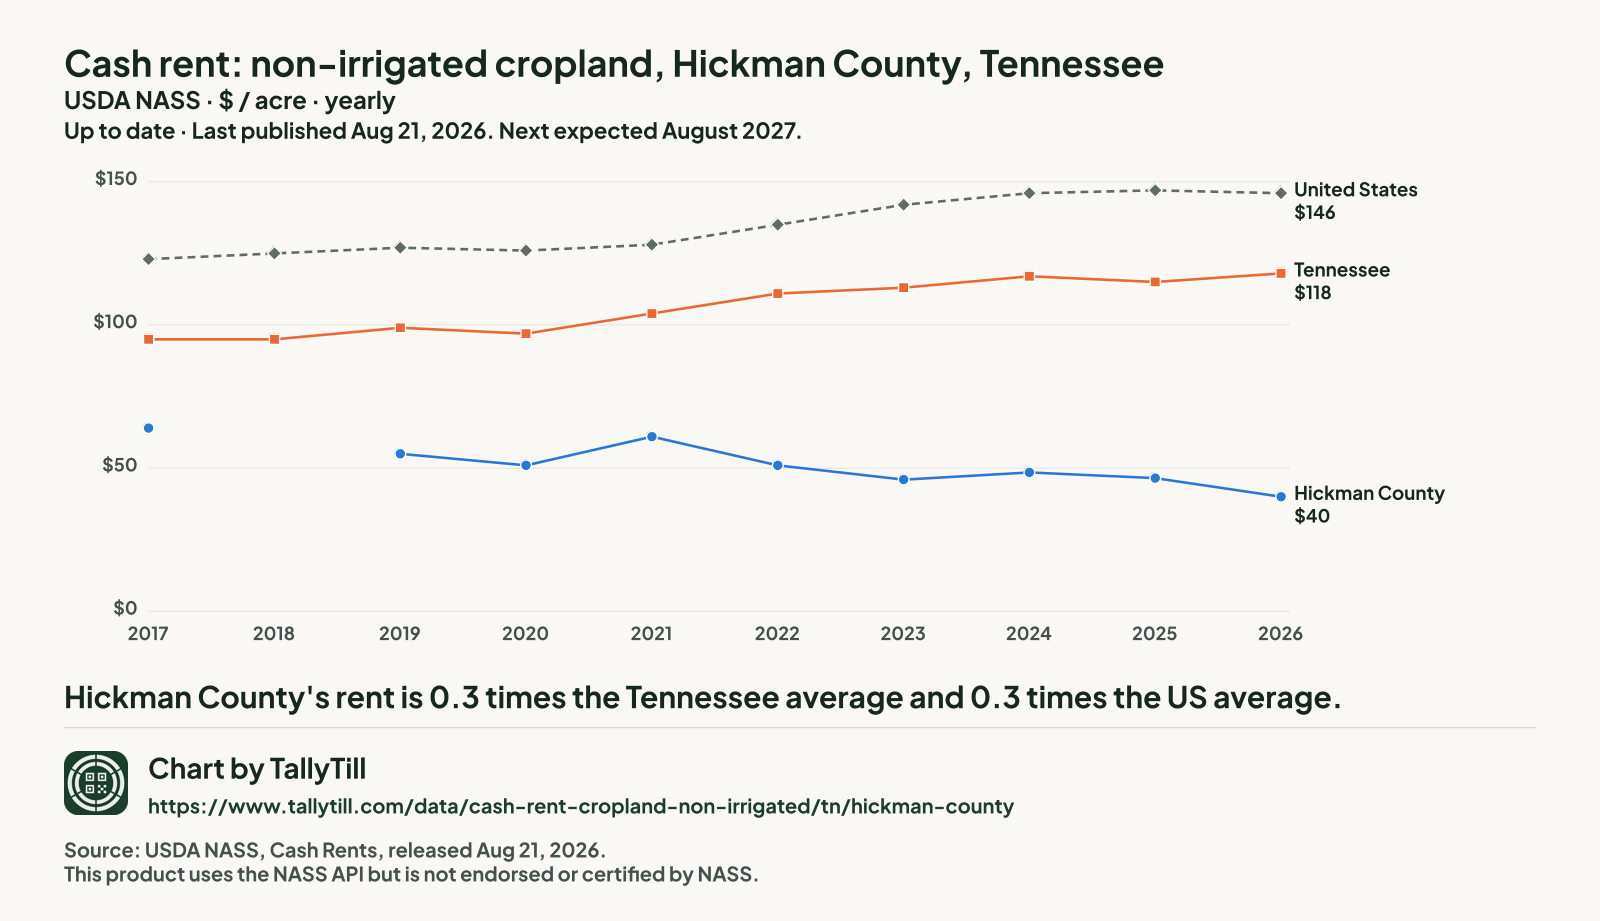
What the numbers say
- Hickman County's rent is 0.3 times the Tennessee average and 0.3 times the US average.
- It is tied for the 20th lowest of the 88 Tennessee counties NASS published for 2026.
- Since 2017 it has fallen 37.5%, from $64 to $40 an acre.
- Gaps are years with no separate Hickman figure: NASS ran no county survey in 2018. Nothing is filled in.
Every figure behind this chart
| Year | Hickman County | Tennessee | United States |
|---|---|---|---|
| 2026 | $40 | $118 | $146 |
| 2025 | $46.50 | $115 | $147 |
| 2024 | $48.50 | $117 | $146 |
| 2023 | $46 | $113 | $142 |
| 2022 | $51 | $111 | $135 |
| 2021 | $61 | $104 | $128 |
| 2020 | $51 | $97 | $126 |
| 2019 | $55 | $99 | $127 |
| 2018 | No county survey that year | $95 | $125 |
| 2017 | $64 | $95 | $123 |
Every Tennessee county, 2026
Darker shading means a higher figure. Values run from $20 an acre in Scott County to $196 an acre in Lake County.
- Under $40 (19 counties)
- $40 to under $80 (36 counties)
- $80 to under $120 (12 counties)
- $120 to under $160 (15 counties)
- $160 and over (6 counties)
- Not published separately (7 counties, $82 an acre combined)
NASS combined Campbell County, Cheatham County, Davidson County, Polk County, Sequatchie County, Shelby County and Van Buren County into "other counties", so they have no figure of their own.
| Rank | County | Figure (dollars an acre) | Precision (CV) |
|---|---|---|---|
| 1 | Lake County | $196 | 5.3% |
| 2 | Robertson County | $187 | 4.9% |
| 3 | Sumner County | $180 | 10.1% |
| 4 | Obion County | $178 | 4.8% |
| 5 | Franklin County | $173 | 6.5% |
| 6 | Dyer County | $161 | 4.6% |
| 7 | Tipton County | $156 | 3.7% |
| 8 | Lincoln County | $155 | 11.4% |
| 9 | Gibson County | $153 | 4.8% |
| 10 | Haywood County | $152 | 10.7% |
| 11 | Weakley County | $145 | 3.5% |
| 12 | Crockett County | $143 | 5.5% |
| 13 | Madison County | $142 | 5.9% |
| 14 | Henry County | $141 | 6.5% |
| 15 | Lauderdale County | $135 | 7.7% |
| 15 | Macon County | $135 | 13.4% |
| 17 | Montgomery County | $132 | 5.3% |
| 18 | Coffee County | $131 | 5.0% |
| 18 | Lawrence County | $131 | 18.0% |
| 20 | Smith County | $130 | 13.4% |
| 21 | Carroll County | $127 | 12.4% |
| 22 | Warren County | $115 | 5.7% |
| 23 | Hardeman County | $110 | 5.7% |
| 24 | De Kalb County | $106 | 19.9% |
| 25 | Fayette County | $105 | 15.9% |
| 26 | Cumberland County | $94 | 10.5% |
| 26 | Perry County | $94 | 5.4% |
| 28 | Cannon County | $93.50 | 15.5% |
| 29 | Henderson County | $92.50 | 9.6% |
| 30 | Chester County | $92 | 14.3% |
| 31 | Hardin County | $91.50 | 12.1% |
| 32 | Maury County | $86.50 | 9.8% |
| 33 | Bedford County | $81.50 | 5.4% |
| 34 | Bledsoe County | $79.50 | 12.6% |
| 35 | Cocke County | $75 | 17.2% |
| 35 | Decatur County | $75 | 9.3% |
| 35 | Putnam County | $75 | 23.4% |
| 38 | Benton County | $73 | 6.5% |
| 38 | Wayne County | $73 | 14.5% |
| 40 | Loudon County | $70 | 18.1% |
| 40 | Marshall County | $70 | 25.0% |
| 40 | McMinn County | $70 | 5.2% |
| 43 | Overton County | $68.50 | 23.5% |
| 44 | McNairy County | $65 | 10.1% |
| 44 | Rutherford County | $65 | 10.8% |
| 46 | Giles County | $64.50 | 11.2% |
| 46 | Houston County | $64.50 | 18.0% |
| 46 | Stewart County | $64.50 | 1.8% |
| 49 | Washington County | $63.50 | 26.9% |
| 50 | Humphreys County | $61.50 | 7.6% |
| 51 | Dickson County | $61 | 18.5% |
| 52 | Marion County | $59 | 20.6% |
| 53 | Unicoi County | $58.50 | 13.5% |
| 54 | Jefferson County | $57.50 | 13.6% |
| 55 | Greene County | $57 | 13.1% |
| 56 | White County | $56.50 | 10.0% |
| 57 | Blount County | $56 | 11.3% |
| 58 | Wilson County | $55.50 | 26.5% |
| 59 | Moore County | $55 | 3.0% |
| 60 | Grundy County | $53.50 | 9.9% |
| 61 | Williamson County | $53 | 16.1% |
| 62 | Monroe County | $52.50 | 8.6% |
| 62 | Morgan County | $52.50 | 18.8% |
| 64 | Hamblen County | $48.50 | 8.5% |
| 65 | Trousdale County | $41 | 8.4% |
| 66 | Clay County | $40 | 5.1% |
| 66 | Hickman County This county | $40 | 5.6% |
| 66 | Jackson County | $40 | 5.0% |
| 66 | Pickett County | $40 | 6.1% |
| 70 | Fentress County | $39.50 | 9.8% |
| 71 | Bradley County | $38 | 12.8% |
| 71 | Roane County | $38 | 6.3% |
| 73 | Knox County | $35.50 | 22.7% |
| 74 | Carter County | $35 | 5.3% |
| 74 | Sevier County | $35 | 3.7% |
| 76 | Sullivan County | $34.50 | 5.7% |
| 77 | Lewis County | $31 | 9.5% |
| 78 | Johnson County | $30 | 5.6% |
| 79 | Claiborne County | $29 | 21.4% |
| 80 | Hamilton County | $28.50 | 13.9% |
| 81 | Grainger County | $27 | 5.2% |
| 82 | Anderson County | $26.50 | 21.4% |
| 83 | Rhea County | $26 | 6.6% |
| 84 | Hawkins County | $25.50 | 4.1% |
| 85 | Meigs County | $25 | 3.7% |
| 85 | Union County | $25 | 3.0% |
| 87 | Hancock County | $23 | 4.7% |
| 88 | Scott County | $20 | 2.8% |
What this measures
NASS asks farm operators what they pay in cash rent per acre, separately for irrigated cropland, non-irrigated cropland and pasture. State figures come out at the end of July; county figures follow in August. When too few farms in a county answer, NASS combines that county with others and publishes one "other counties" figure, so some counties have no figure of their own.