Cash rent for non-irrigated cropland: Lancaster County, Virginia
The average cash rent farmers paid per acre for non-irrigated cropland, from USDA's yearly cash rents survey.
The latest figures and how they have changed
 Chart by TallyTill · tallytill.com
What the numbers say
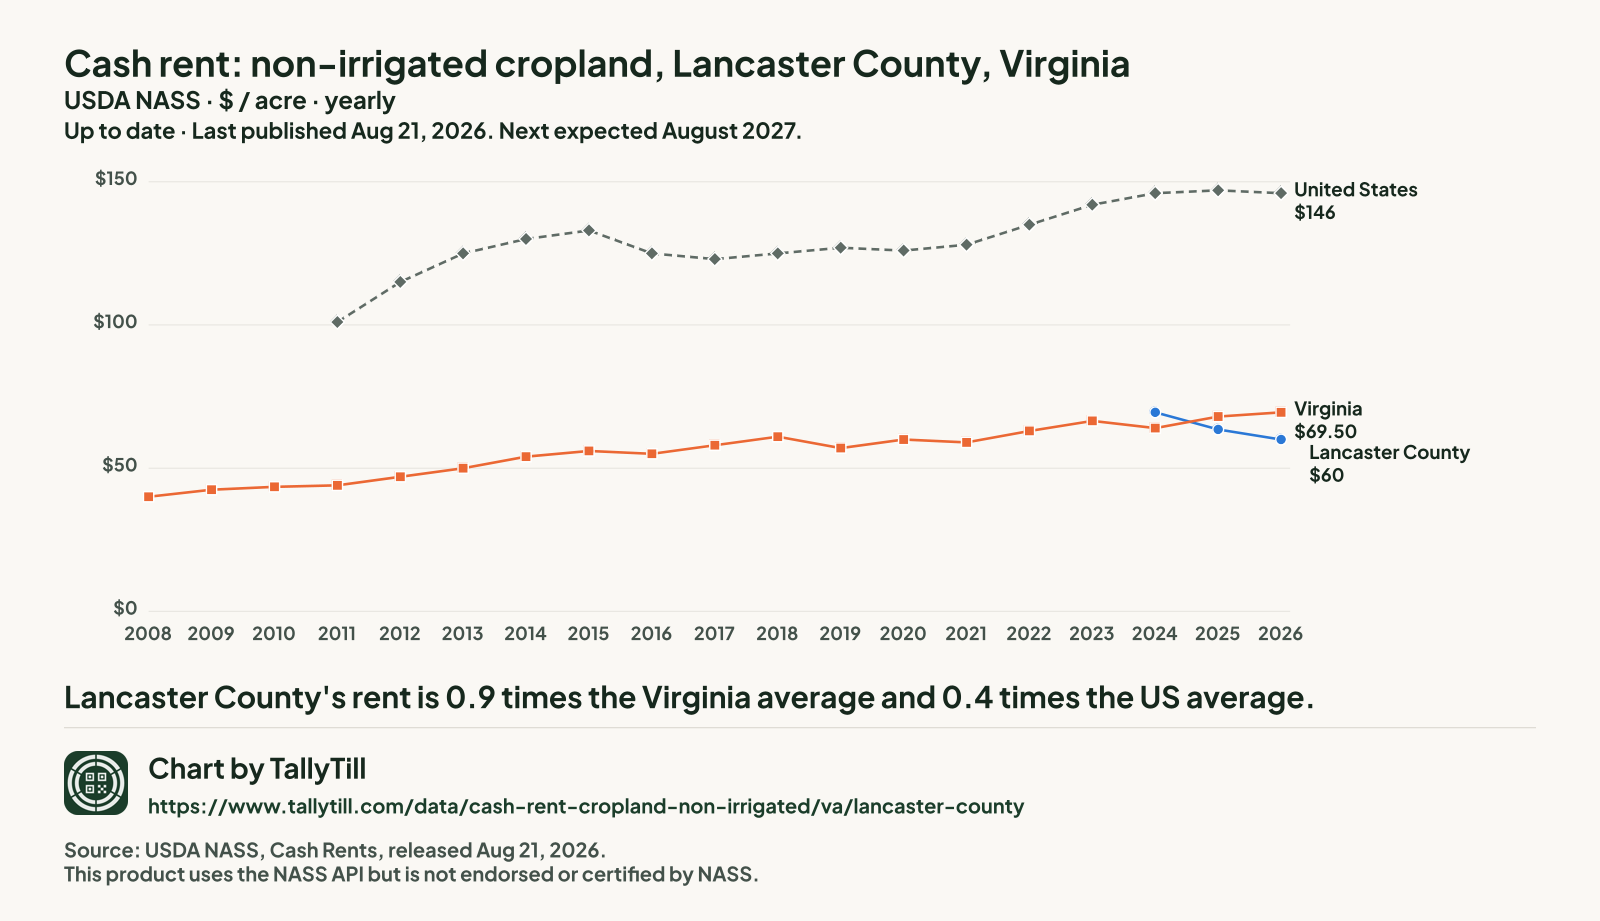
- Lancaster County's rent is 0.9 times the Virginia average and 0.4 times the US average.
- It is the 32nd highest of the 86 Virginia counties NASS published for 2026.
- Since 2024 it has fallen 13.7%, from $69.50 to $60 an acre.
- Gaps are years with no separate Lancaster figure: NASS ran no county survey in 2015 or 2018, in 2009, 2010, 2011, 2012, 2013, 2014, 2016, 2017, 2019, 2020, 2021, 2022 and 2023 it combined Lancaster into "other counties", and NASS had no figure available in 2008. Nothing is filled in.
Every figure behind this chart
| Year | Lancaster County | Virginia | United States |
|---|---|---|---|
| 2026 | $60 | $69.50 | $146 |
| 2025 | $63.50 | $68 | $147 |
| 2024 | $69.50 | $64 | $146 |
| 2023 | Combined into "other counties" | $66.50 | $142 |
| 2022 | Combined into "other counties" | $63 | $135 |
| 2021 | Combined into "other counties" | $59 | $128 |
| 2020 | Combined into "other counties" | $60 | $126 |
| 2019 | Combined into "other counties" | $57 | $127 |
| 2018 | No county survey that year | $61 | $125 |
| 2017 | Combined into "other counties" | $58 | $123 |
| 2016 | Combined into "other counties" | $55 | $125 |
| 2015 | No county survey that year | $56 | $133 |
| 2014 | Combined into "other counties" | $54 | $130 |
| 2013 | Combined into "other counties" | $50 | $125 |
| 2012 | Combined into "other counties" | $47 | $115 |
| 2011 | Combined into "other counties" | $44 | $101 |
| 2010 | Combined into "other counties" | $43.50 | No figure |
| 2009 | Combined into "other counties" | $42.50 | No figure |
| 2008 | Not available | $40 | No figure |
Every Virginia county, 2026
Darker shading means a higher figure. Values run from $20 an acre in Roanoke County to $112 an acre in Accomack County.
- Under $40 (27 counties)
- $40 to under $80 (42 counties)
- $80 to under $120 (17 counties)
- $120 to under $160 (0 counties)
- $160 and over (0 counties)
- Not published separately (47 counties, $59.50 an acre combined)
NASS combined Alexandria city, Arlington County, Bristol city, Brunswick County, Buchanan County, Buena Vista city, Charlottesville city, Chesapeake city, Colonial Heights city, Covington city, Danville city, Dickenson County, Emporia city, Fairfax city, Fairfax County, Falls Church city, Franklin city, Fredericksburg city, Galax city, Hampton city, Harrisonburg city, Highland County, Hopewell city, James City, King George County, Lexington city, Lynchburg city, Manassas city, Manassas Park city, Martinsville city, Mathews County, Newport News city, Norfolk city, Norton city, Petersburg city, Poquoson city, Portsmouth city, Powhatan County, Radford city, Richmond city, Roanoke city, Salem city, Staunton city, Waynesboro city, Williamsburg city, Winchester city and York County into "other counties", so they have no figure of their own.
What this measures
NASS asks farm operators what they pay in cash rent per acre, separately for irrigated cropland, non-irrigated cropland and pasture. State figures come out at the end of July; county figures follow in August. When too few farms in a county answer, NASS combines that county with others and publishes one "other counties" figure, so some counties have no figure of their own.