Cash rent for non-irrigated cropland: Price County, Wisconsin
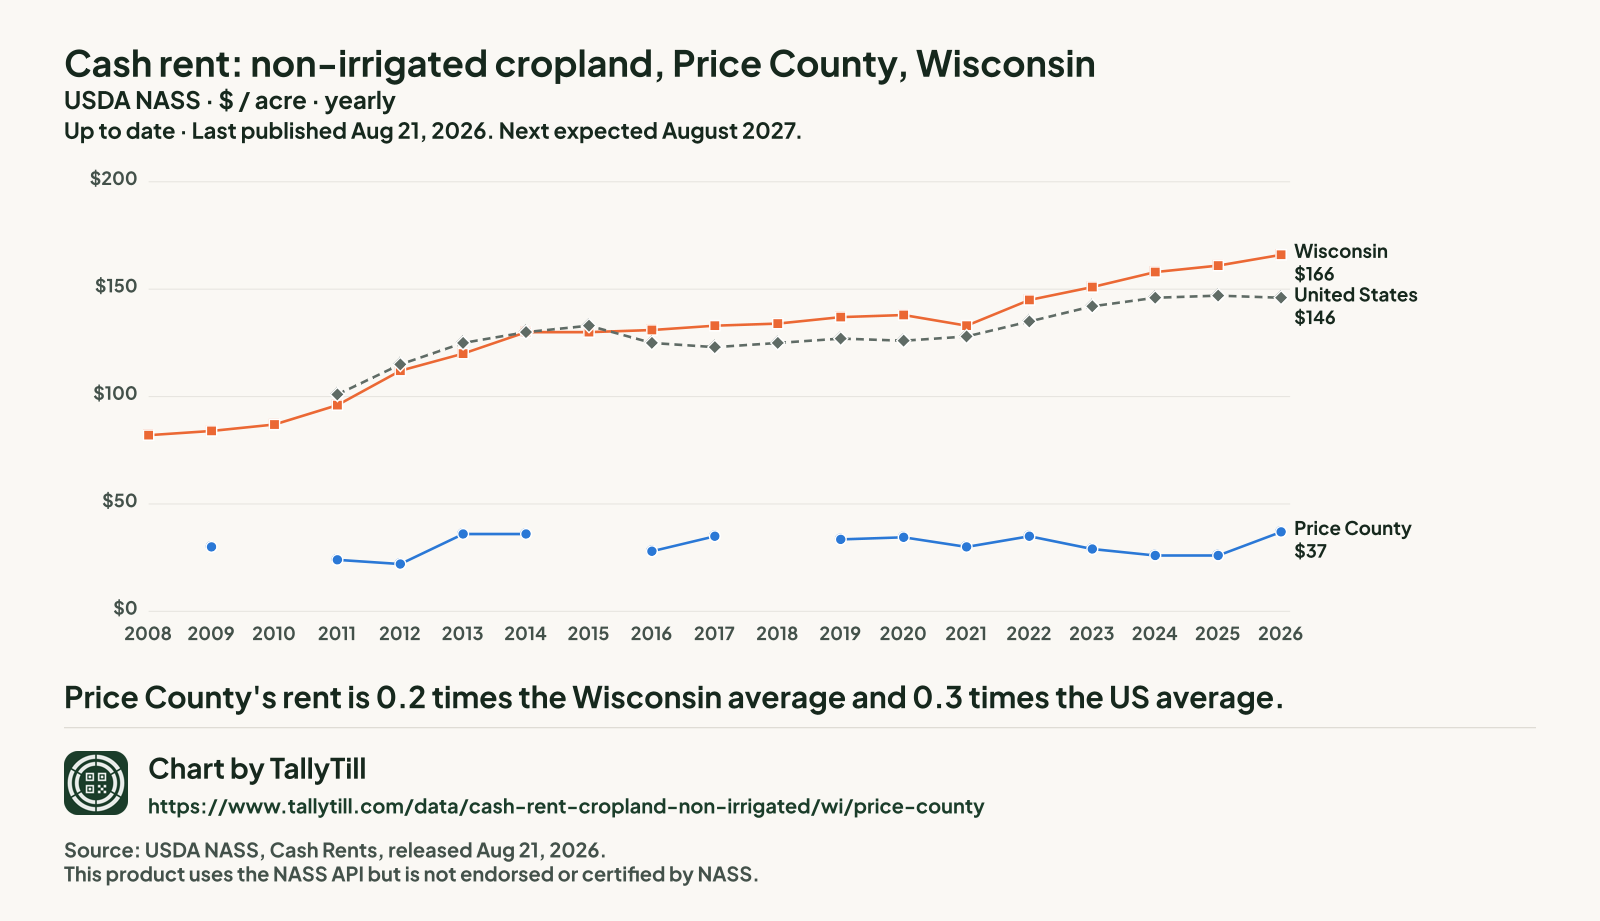
The average cash rent farmers paid per acre for non-irrigated cropland, from USDA's yearly cash rents survey.
The latest figures and how they have changed
 Chart by TallyTill · tallytill.com
What the numbers say
- Price County's rent is 0.2 times the Wisconsin average and 0.3 times the US average.
- It is the 4th lowest of the 68 Wisconsin counties NASS published for 2026.
- Since 2009 it has risen 23.3%, from $30 to $37 an acre.
- Gaps are years with no separate Price figure: NASS ran no county survey in 2015 or 2018, in 2010 it combined Price into "other counties", and NASS had no figure available in 2008. Nothing is filled in.
Every figure behind this chart
| Year | Price County | Wisconsin | United States |
|---|---|---|---|
| 2026 | $37 | $166 | $146 |
| 2025 | $26 | $161 | $147 |
| 2024 | $26 | $158 | $146 |
| 2023 | $29 | $151 | $142 |
| 2022 | $35 | $145 | $135 |
| 2021 | $30 | $133 | $128 |
| 2020 | $34.50 | $138 | $126 |
| 2019 | $33.50 | $137 | $127 |
| 2018 | No county survey that year | $134 | $125 |
| 2017 | $35 | $133 | $123 |
| 2016 | $28 | $131 | $125 |
| 2015 | No county survey that year | $130 | $133 |
| 2014 | $36 | $130 | $130 |
| 2013 | $36 | $120 | $125 |
| 2012 | $22 | $112 | $115 |
| 2011 | $24 | $96 | $101 |
| 2010 | Combined into "other counties" | $87 | No figure |
| 2009 | $30 | $84 | No figure |
| 2008 | Not available | $82 | No figure |
Every Wisconsin county, 2026
Darker shading means a higher figure. Values run from $16 an acre in Douglas County to $247 an acre in Grant County.
- Under $40 (5 counties)
- $40 to under $80 (7 counties)
- $80 to under $120 (11 counties)
- $120 to under $160 (21 counties)
- $160 and over (24 counties)
- Not published separately (4 counties, $39 an acre combined)
NASS combined Iron County, Menominee County, Oneida County and Vilas County into "other counties", so they have no figure of their own.
| Rank | County | Figure (dollars an acre) | Precision (CV) |
|---|---|---|---|
| 1 | Grant County | $247 | 4.5% |
| 2 | Lafayette County | $240 | 2.5% |
| 3 | Walworth County | $236 | 7.3% |
| 4 | Dane County | $231 | 3.4% |
| 5 | Kewaunee County | $228 | 5.8% |
| 6 | Green County | $223 | 4.0% |
| 6 | Rock County | $223 | 5.5% |
| 8 | Columbia County | $215 | 4.9% |
| 9 | Brown County | $213 | 5.7% |
| 10 | Dodge County | $212 | 2.7% |
| 11 | Fond du Lac County | $203 | 9.7% |
| 12 | Manitowoc County | $199 | 2.5% |
| 13 | Jefferson County | $197 | 3.3% |
| 14 | Iowa County | $196 | 3.6% |
| 15 | Green Lake County | $195 | 3.5% |
| 16 | Calumet County | $187 | 5.0% |
| 17 | Pepin County | $185 | 3.8% |
| 18 | Kenosha County | $184 | 6.3% |
| 19 | Pierce County | $179 | 8.3% |
| 20 | Racine County | $175 | 6.6% |
| 21 | Waukesha County | $171 | 7.5% |
| 22 | Crawford County | $167 | 4.6% |
| 23 | La Crosse County | $165 | 4.5% |
| 24 | Outagamie County | $161 | 3.3% |
| 25 | Sauk County | $158 | 4.6% |
| 26 | Richland County | $155 | 8.1% |
| 27 | Monroe County | $154 | 6.4% |
| 27 | Oconto County | $154 | 4.2% |
| 29 | Sheboygan County | $151 | 6.1% |
| 30 | Vernon County | $145 | 5.6% |
| 31 | Trempealeau County | $144 | 4.9% |
| 32 | Jackson County | $143 | 4.6% |
| 33 | Shawano County | $142 | 3.7% |
| 34 | Buffalo County | $139 | 2.8% |
| 35 | Marathon County | $133 | 8.3% |
| 36 | Dunn County | $131 | 3.3% |
| 37 | Waupaca County | $129 | 4.8% |
| 38 | St Croix County | $127 | 4.4% |
| 39 | Chippewa County | $125 | 2.7% |
| 39 | Eau Claire County | $125 | 4.3% |
| 41 | Marinette County | $124 | 8.7% |
| 42 | Winnebago County | $123 | 2.8% |
| 43 | Polk County | $122 | 8.7% |
| 44 | Door County | $120 | 3.0% |
| 44 | Juneau County | $120 | 9.3% |
| 46 | Clark County | $119 | 3.2% |
| 46 | Washington County | $119 | 3.4% |
| 48 | Ozaukee County | $118 | 3.4% |
| 48 | Taylor County | $118 | 8.6% |
| 50 | Rusk County | $104 | 9.0% |
| 51 | Barron County | $103 | 3.1% |
| 51 | Langlade County | $103 | 7.1% |
| 53 | Milwaukee County | $101 | 6.8% |
| 54 | Marquette County | $91 | 8.6% |
| 55 | Portage County | $85.50 | 10.8% |
| 56 | Wood County | $81.50 | 7.6% |
| 57 | Waushara County | $78 | 7.3% |
| 58 | Adams County | $74 | 11.2% |
| 59 | Lincoln County | $69.50 | 7.6% |
| 60 | Washburn County | $67.50 | 7.1% |
| 61 | Sawyer County | $60.50 | 7.2% |
| 62 | Burnett County | $56.50 | 7.3% |
| 63 | Forest County | $40 | 23.5% |
| 64 | Ashland County | $38.50 | 9.2% |
| 65 | Price County This county | $37 | 5.2% |
| 66 | Bayfield County | $28.50 | 7.1% |
| 67 | Florence County | $25 | 10.6% |
| 68 | Douglas County | $16 | 5.4% |
What this measures
NASS asks farm operators what they pay in cash rent per acre, separately for irrigated cropland, non-irrigated cropland and pasture. State figures come out at the end of July; county figures follow in August. When too few farms in a county answer, NASS combines that county with others and publishes one "other counties" figure, so some counties have no figure of their own.