Cash rent for pasture: San Benito County, California
The average cash rent farmers paid per acre for pasture, from USDA's yearly cash rents survey.
The latest figures and how they have changed
 Chart by TallyTill · tallytill.com
What the numbers say
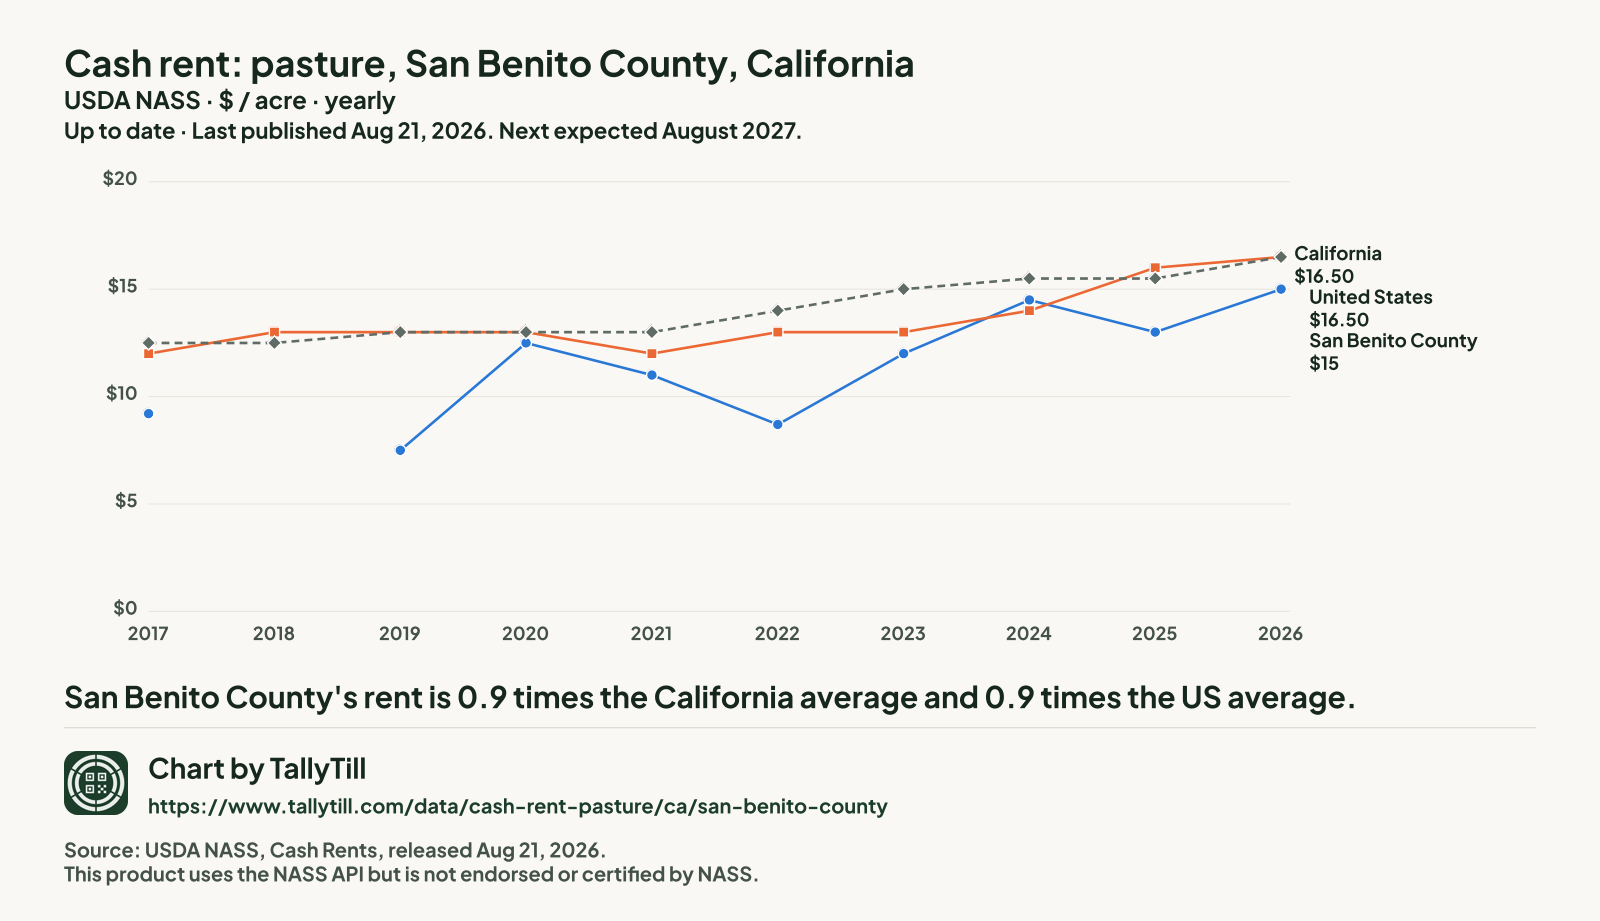
- San Benito County's rent is 0.9 times the California average and 0.9 times the US average.
- It is tied for the 15th lowest of the 38 California counties NASS published for 2026.
- Since 2017 it has risen 63.0%, from $9.20 to $15 an acre.
- Gaps are years with no separate San Benito figure: NASS ran no county survey in 2018. Nothing is filled in.
Every figure behind this chart
| Year | San Benito County | California | United States |
|---|---|---|---|
| 2026 | $15 | $16.50 | $16.50 |
| 2025 | $13 | $16 | $15.50 |
| 2024 | $14.50 | $14 | $15.50 |
| 2023 | $12 | $13 | $15 |
| 2022 | $8.70 | $13 | $14 |
| 2021 | $11 | $12 | $13 |
| 2020 | $12.50 | $13 | $13 |
| 2019 | $7.50 | $13 | $13 |
| 2018 | No county survey that year | $13 | $12.50 |
| 2017 | $9.20 | $12 | $12.50 |
Every California county, 2026
Darker shading means a higher figure. Values run from $5.50 an acre in Ventura County to $42 an acre in Marin County.
- Under $13 (7 counties)
- $13 to under $15 (7 counties)
- $15 to under $20 (8 counties)
- $20 to under $25 (8 counties)
- $25 and over (8 counties)
- Not published separately (20 counties, $12 an acre combined)
NASS combined Alpine County, Del Norte County, Imperial County, Kern County, Kings County, Los Angeles County, Mono County, Napa County, Orange County, Plumas County, Riverside County, San Bernardino County, San Diego County, San Francisco County, San Joaquin County, San Mateo County, Sierra County, Solano County, Trinity County and Yuba County into "other counties", so they have no figure of their own.
| Rank | County | Figure (dollars an acre) | Precision (CV) |
|---|---|---|---|
| 1 | Marin County | $42 | 23.8% |
| 2 | Sutter County | $32 | 4.1% |
| 3 | Glenn County | $31 | 11.5% |
| 4 | Stanislaus County | $28.50 | 8.3% |
| 5 | Nevada County | $28 | 11.2% |
| 6 | Placer County | $26.50 | 8.9% |
| 7 | Sacramento County | $25 | 7.2% |
| 7 | Santa Cruz County | $25 | 25.2% |
| 9 | Tuolumne County | $24 | 13.4% |
| 10 | Colusa County | $23.50 | 11.2% |
| 10 | Contra Costa County | $23.50 | 7.8% |
| 10 | Merced County | $23.50 | 9.6% |
| 10 | Sonoma County | $23.50 | 24.3% |
| 14 | Amador County | $20 | 11.3% |
| 14 | Butte County | $20 | 8.7% |
| 14 | San Luis Obispo County | $20 | 15.1% |
| 17 | Mariposa County | $19.50 | 10.1% |
| 18 | Humboldt County | $18.50 | 16.8% |
| 19 | Lassen County | $17.50 | 9.3% |
| 19 | Monterey County | $17.50 | 7.8% |
| 21 | Modoc County | $15.50 | 18.5% |
| 22 | Lake County | $15 | 5.6% |
| 22 | San Benito County This county | $15 | 15.8% |
| 22 | Yolo County | $15 | 5.5% |
| 25 | Alameda County | $14.50 | 12.1% |
| 25 | Calaveras County | $14.50 | 12.4% |
| 25 | Shasta County | $14.50 | 14.1% |
| 28 | El Dorado County | $14 | 15.2% |
| 28 | Tulare County | $14 | 7.7% |
| 30 | Mendocino County | $13 | 2.4% |
| 30 | Siskiyou County | $13 | 5.1% |
| 32 | Madera County | $12 | 11.4% |
| 33 | Fresno County | $11.50 | 9.7% |
| 34 | Tehama County | $11 | 8.1% |
| 35 | Inyo County | $10 | 6.3% |
| 36 | Santa Barbara County | $9.90 | 7.5% |
| 37 | Santa Clara County | $5.60 | 10.4% |
| 38 | Ventura County | $5.50 | 9.5% |
What this measures
NASS asks farm operators what they pay in cash rent per acre, separately for irrigated cropland, non-irrigated cropland and pasture. State figures come out at the end of July; county figures follow in August. When too few farms in a county answer, NASS combines that county with others and publishes one "other counties" figure, so some counties have no figure of their own.