Cash rent for pasture: Kootenai County, Idaho
The average cash rent farmers paid per acre for pasture, from USDA's yearly cash rents survey.
The latest figures and how they have changed
 Chart by TallyTill · tallytill.com
What the numbers say
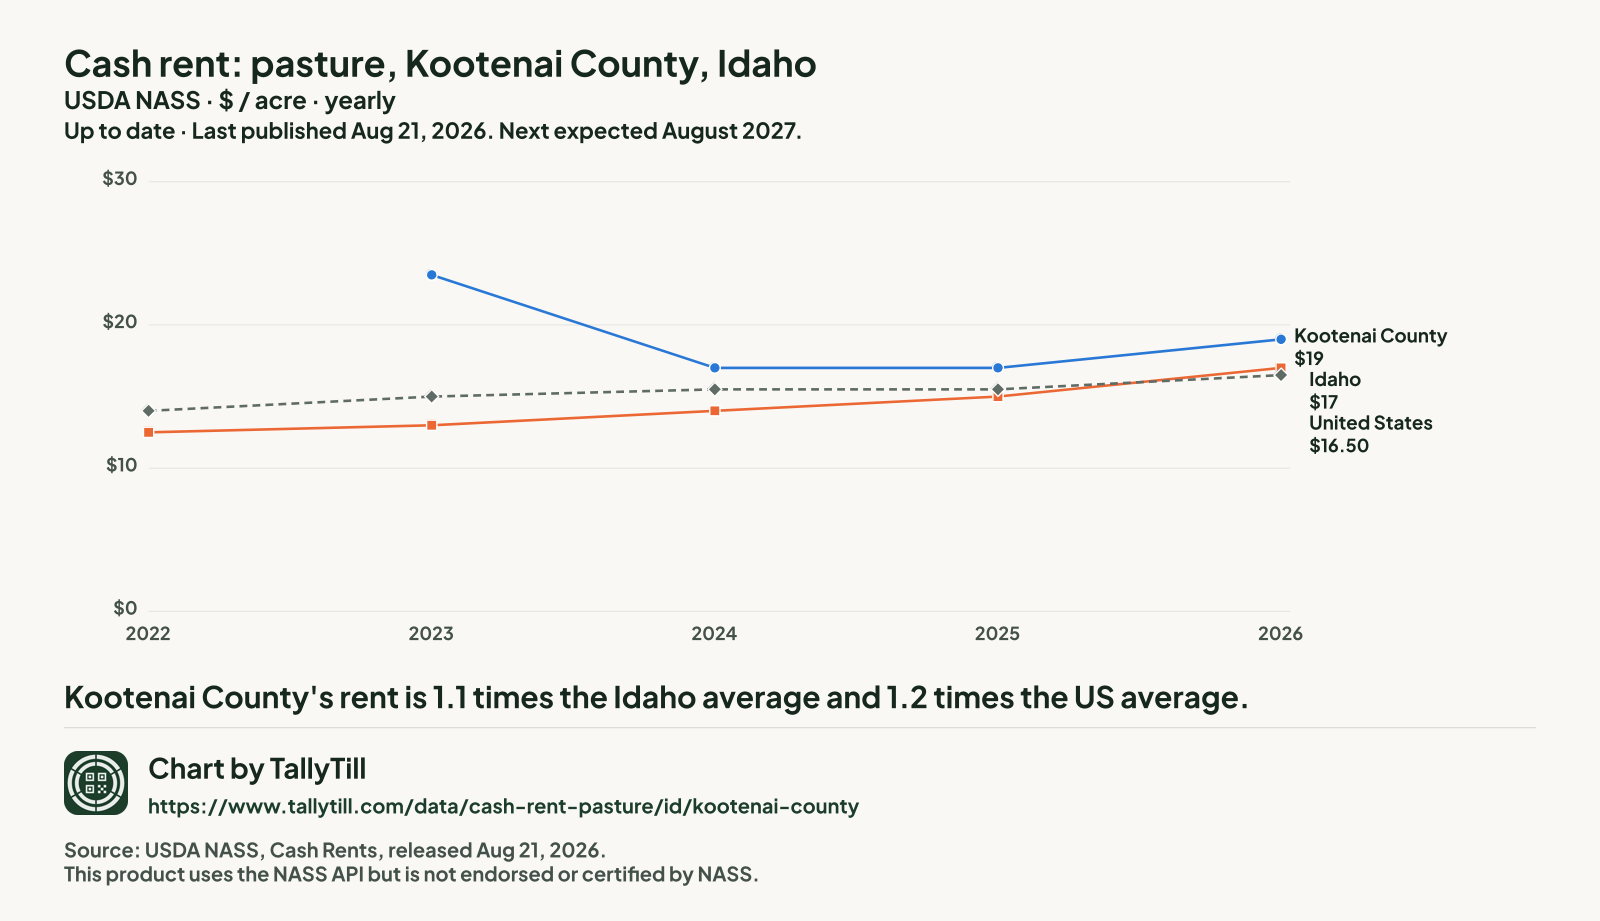
- Kootenai County's rent is 1.1 times the Idaho average and 1.2 times the US average.
- It is tied for the 11th highest of the 27 Idaho counties NASS published for 2026.
- Since 2023 it has fallen 19.1%, from $23.50 to $19 an acre.
- Gaps are years with no separate Kootenai figure: in 2022 NASS combined Kootenai into "other counties". Nothing is filled in.
Every figure behind this chart
| Year | Kootenai County | Idaho | United States |
|---|---|---|---|
| 2026 | $19 | $17 | $16.50 |
| 2025 | $17 | $15 | $15.50 |
| 2024 | $17 | $14 | $15.50 |
| 2023 | $23.50 | $13 | $15 |
| 2022 | Combined into "other counties" | $12.50 | $14 |
Every Idaho county, 2026
Darker shading means a higher figure. Values run from $9.20 an acre in Idaho County to $50 an acre in Lincoln County.
- Under $11 (5 counties)
- $11 to under $16 (5 counties)
- $16 to under $19 (5 counties)
- $19 to under $25 (5 counties)
- $25 and over (7 counties)
- Not published separately (17 counties, $20.50 an acre combined)
NASS combined Benewah County, Boise County, Butte County, Canyon County, Caribou County, Elmore County, Franklin County, Jerome County, Lewis County, Madison County, Minidoka County, Nez Perce County, Payette County, Power County, Shoshone County, Twin Falls County and Washington County into "other counties", so they have no figure of their own.
| Rank | County | Figure (dollars an acre) | Precision (CV) |
|---|---|---|---|
| 1 | Lincoln County | $50 | 14.9% |
| 2 | Fremont County | $39 | 8.6% |
| 3 | Adams County | $30 | 11.0% |
| 4 | Jefferson County | $28 | 4.9% |
| 5 | Clark County | $25 | 15.0% |
| 5 | Gooding County | $25 | 39.1% |
| 5 | Lemhi County | $25 | 18.7% |
| 8 | Bingham County | $22 | 18.5% |
| 9 | Teton County | $21.50 | 13.1% |
| 10 | Valley County | $21 | 19.1% |
| 11 | Clearwater County | $19 | 17.3% |
| 11 | Kootenai County This county | $19 | 15.2% |
| 13 | Boundary County | $17.50 | 15.5% |
| 14 | Bonneville County | $16.50 | 52.5% |
| 14 | Owyhee County | $16.50 | 8.9% |
| 16 | Bear Lake County | $16 | 10.8% |
| 16 | Custer County | $16 | 41.5% |
| 18 | Blaine County | $15.50 | 22.2% |
| 19 | Bannock County | $12.50 | 11.2% |
| 20 | Ada County | $12 | 25.3% |
| 20 | Cassia County | $12 | 12.6% |
| 22 | Camas County | $11 | 18.4% |
| 23 | Bonner County | $10.50 | 36.2% |
| 24 | Latah County | $9.80 | 11.7% |
| 25 | Oneida County | $9.50 | 12.4% |
| 26 | Gem County | $9.40 | 18.2% |
| 27 | Idaho County | $9.20 | 12.6% |
What this measures
NASS asks farm operators what they pay in cash rent per acre, separately for irrigated cropland, non-irrigated cropland and pasture. State figures come out at the end of July; county figures follow in August. When too few farms in a county answer, NASS combines that county with others and publishes one "other counties" figure, so some counties have no figure of their own.