Farm & food prices · Production and land

Cash rent for pasture: Russell County, Kentucky

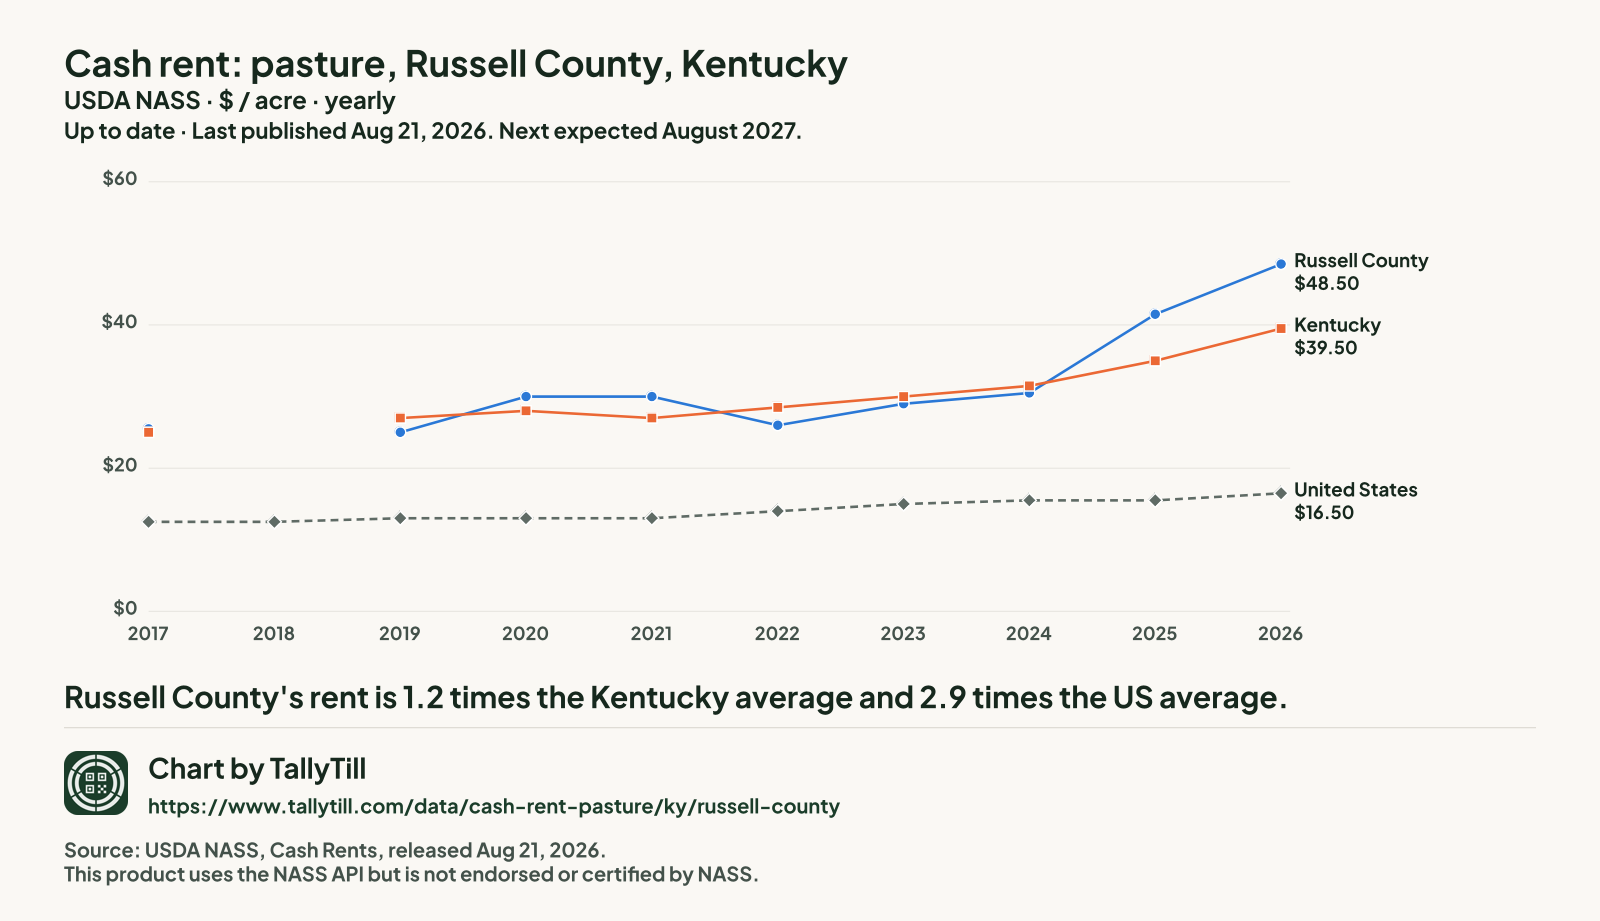
The average cash rent farmers paid per acre for pasture, from USDA's yearly cash rents survey.

Choose a place Show the figures for the place you chose.
Up to dateYearly. States at the end of July, counties in August. Last published Aug 21, 2026. Next expected August 2027.

The latest figures and how they have changed

Russell County, 2026
$48.50 an acre
Up 16.9% from $41.50 in 2025
Kentucky, 2026
$39.50 an acre
Up 12.9% from $35 in 2025
United States, 2026
$16.50 an acre
Up 6.5% from $15.50 in 2025
Russell CountyKentuckyUnited States
$0$20$40$602017201820192020202120222023202420252026Russell County$48.50Kentucky$39.50United States$16.50

Chart by TallyTill · tallytill.com

View the dataOpen every figure behind this chart in a table.Save imageSave this chart as a picture.

What the numbers say

  • Russell County's rent is 1.2 times the Kentucky average and 2.9 times the US average.
  • It is the 15th highest of the 68 Kentucky counties NASS published for 2026.
  • Since 2017 it has risen 90.2%, from $25.50 to $48.50 an acre.
  • Gaps are years with no separate Russell figure: NASS ran no county survey in 2018. Nothing is filled in.

Every figure behind this chart

Cash rent: pasture, dollars an acre
YearRussell CountyKentuckyUnited States
2026$48.50$39.50$16.50
2025$41.50$35$15.50
2024$30.50$31.50$15.50
2023$29$30$15
2022$26$28.50$14
2021$30$27$13
2020$30$28$13
2019$25$27$13
2018No county survey that yearNo figure$12.50
2017$25.50$25$12.50
Get a link and a preview picture of this chart to share. Get the code to show this chart on your own website.

Share this chart

FacebookShare this link on Facebook.XShare this link on X.LinkedInShare this link on LinkedIn.RedditShare this link on Reddit.PinterestShare this link on Pinterest.EmailEmail this link.Open the share menu on your device. Copy the link to your clipboard.

Embed this chart on your site

Copy the code to your clipboard.

The chart shows the latest figures TallyTill has collected and updates itself when a new release is collected. Keep the link under it: it credits the source and the explorer.

Every Kentucky county, 2026

Darker shading means a higher figure. Values run from $13.50 an acre in Pendleton County to $59.50 an acre in Barren County.

Adair County: $41 an acreAllen County: $55.50 an acreAnderson County: $31 an acreBallard County: combined into "other counties"Barren County: $59.50 an acreBath County: combined into "other counties"Bell County: combined into "other counties"Boone County: $32 an acreBourbon County: $54 an acreBoyd County: combined into "other counties"Boyle County: $44 an acreBracken County: $19 an acreBreathitt County: combined into "other counties"Breckinridge County: $36 an acreBullitt County: $29.50 an acreButler County: $20 an acreCaldwell County: $42 an acreCalloway County: $52 an acreCampbell County: combined into "other counties"Carlisle County: combined into "other counties"Carroll County: combined into "other counties"Carter County: $24.50 an acreCasey County: $32.50 an acreChristian County: $51 an acreClark County: $54 an acreClay County: combined into "other counties"Clinton County: combined into "other counties"Crittenden County: $33 an acreCumberland County: $34 an acreDaviess County: $33.50 an acreEdmonson County: $43.50 an acreElliott County: combined into "other counties"Estill County: $21 an acreFayette County: $39.50 an acreFleming County: $33 an acreFloyd County: combined into "other counties"Franklin County: combined into "other counties"Fulton County: combined into "other counties"Gallatin County: combined into "other counties"Garrard County: $38 an acreGrant County: $26.50 an acreGraves County: combined into "other counties"Grayson County: $41 an acreGreen County: $38 an acreGreenup County: $20 an acreHancock County: $32.50 an acreHardin County: $52 an acreHarlan County: combined into "other counties"Harrison County: $29 an acreHart County: $52.50 an acreHenderson County: combined into "other counties"Henry County: $33.50 an acreHickman County: combined into "other counties"Hopkins County: combined into "other counties"Jackson County: $14 an acreJefferson County: combined into "other counties"Jessamine County: combined into "other counties"Johnson County: combined into "other counties"Kenton County: $22 an acreKnott County: combined into "other counties"Knox County: combined into "other counties"Larue County: $45 an acreLaurel County: $28.50 an acreLawrence County: combined into "other counties"Lee County: combined into "other counties"Leslie County: combined into "other counties"Letcher County: combined into "other counties"Lewis County: $39 an acreLincoln County: $38.50 an acreLivingston County: $45.50 an acreLogan County: $55 an acreLyon County: combined into "other counties"McCracken County: combined into "other counties"McCreary County: combined into "other counties"McLean County: combined into "other counties"Madison County: $28 an acreMagoffin County: combined into "other counties"Marion County: $46 an acreMarshall County: combined into "other counties"Martin County: combined into "other counties"Mason County: $39 an acreMeade County: $49.50 an acreMenifee County: combined into "other counties"Mercer County: combined into "other counties"Metcalfe County: $35 an acreMonroe County: $51.50 an acreMontgomery County: $43.50 an acreMorgan County: $16.50 an acreMuhlenberg County: combined into "other counties"Nelson County: $42.50 an acreNicholas County: $35 an acreOhio County: $38 an acreOldham County: combined into "other counties"Owen County: combined into "other counties"Owsley County: combined into "other counties"Pendleton County: $13.50 an acrePerry County: combined into "other counties"Pike County: combined into "other counties"Powell County: combined into "other counties"Pulaski County: $41 an acreRobertson County: combined into "other counties"Rockcastle County: $30 an acreRowan County: combined into "other counties"Russell County: $48.50 an acreScott County: $43 an acreShelby County: combined into "other counties"Simpson County: combined into "other counties"Spencer County: combined into "other counties"Taylor County: $45 an acreTodd County: $55.50 an acreTrigg County: $52 an acreTrimble County: combined into "other counties"Union County: $46.50 an acreWarren County: $54.50 an acreWashington County: $35.50 an acreWayne County: $35.50 an acreWebster County: $46.50 an acreWhitley County: $15.50 an acreWolfe County: combined into "other counties"Woodford County: $29 an acreRussell $48.50Russell $48.50
  • Under $29 (13 counties)
  • $29 to under $35 (13 counties)
  • $35 to under $41 (12 counties)
  • $41 to under $49.50 (16 counties)
  • $49.50 and over (14 counties)
  • Not published separately (52 counties, $37.50 an acre combined)

NASS combined Ballard County, Bath County, Bell County, Boyd County, Breathitt County, Campbell County, Carlisle County, Carroll County, Clay County, Clinton County, Elliott County, Floyd County, Franklin County, Fulton County, Gallatin County, Graves County, Harlan County, Henderson County, Hickman County, Hopkins County, Jefferson County, Jessamine County, Johnson County, Knott County, Knox County, Lawrence County, Lee County, Leslie County, Letcher County, Lyon County, Magoffin County, Marshall County, Martin County, McCracken County, McCreary County, McLean County, Menifee County, Mercer County, Muhlenberg County, Oldham County, Owen County, Owsley County, Perry County, Pike County, Powell County, Robertson County, Rowan County, Shelby County, Simpson County, Spencer County, Trimble County and Wolfe County into "other counties", so they have no figure of their own.

Published Kentucky counties, highest first, 2026
Rank County Figure (dollars an acre) Precision (CV)
1 Barren County $59.50 7.2%
2 Allen County $55.50 13.6%
2 Todd County $55.50 7.5%
4 Logan County $55 7.7%
5 Warren County $54.50 2.8%
6 Bourbon County $54 18.9%
6 Clark County $54 10.2%
8 Hart County $52.50 4.9%
9 Calloway County $52 16.4%
9 Hardin County $52 12.6%
9 Trigg County $52 21.5%
12 Monroe County $51.50 16.3%
13 Christian County $51 11.5%
14 Meade County $49.50 15.5%
15 Russell County This county $48.50 5.6%
16 Union County $46.50 6.8%
16 Webster County $46.50 9.4%
18 Marion County $46 7.6%
19 Livingston County $45.50 6.1%
20 Larue County $45 9.1%
20 Taylor County $45 10.3%
22 Boyle County $44 6.2%
23 Edmonson County $43.50 6.4%
23 Montgomery County $43.50 8.2%
25 Scott County $43 11.5%
26 Nelson County $42.50 3.7%
27 Caldwell County $42 6.6%
28 Adair County $41 11.8%
28 Grayson County $41 9.8%
28 Pulaski County $41 6.5%
31 Fayette County $39.50 9.1%
32 Lewis County $39 9.7%
32 Mason County $39 16.5%
34 Lincoln County $38.50 7.8%
35 Garrard County $38 9.9%
35 Green County $38 7.5%
35 Ohio County $38 13.7%
38 Breckinridge County $36 4.2%
39 Washington County $35.50 6.4%
39 Wayne County $35.50 18.0%
41 Metcalfe County $35 9.3%
41 Nicholas County $35 5.2%
43 Cumberland County $34 4.6%
44 Daviess County $33.50 14.9%
44 Henry County $33.50 8.0%
46 Crittenden County $33 9.7%
46 Fleming County $33 13.4%
48 Casey County $32.50 7.5%
48 Hancock County $32.50 7.9%
50 Boone County $32 5.5%
51 Anderson County $31 6.6%
52 Rockcastle County $30 4.9%
53 Bullitt County $29.50 18.3%
54 Harrison County $29 11.2%
54 Woodford County $29 5.9%
56 Laurel County $28.50 6.3%
57 Madison County $28 8.3%
58 Grant County $26.50 5.5%
59 Carter County $24.50 24.4%
60 Kenton County $22 4.0%
61 Estill County $21 2.5%
62 Butler County $20 9.5%
62 Greenup County $20 7.4%
64 Bracken County $19 7.1%
65 Morgan County $16.50 19.3%
66 Whitley County $15.50 15.2%
67 Jackson County $14 14.6%
68 Pendleton County $13.50 9.8%
Source: USDA National Agricultural Statistics Service (NASS), Cash Rents Survey. County estimates released Aug 21, 2026; state and US estimates released Jul 31, 2026. Quick Stats item "RENT, CASH, PASTURELAND - EXPENSE, MEASURED IN $ / ACRE". Retrieved Oct 20, 2026; snapshot 2026-10-20.1. Precision: NASS's coefficient of variation for Russell is 5.6% (lower means more precise). Dollars as published, not adjusted for inflation. This product uses the NASS API but is not endorsed or certified by NASS.

What this measures

NASS asks farm operators what they pay in cash rent per acre, separately for irrigated cropland, non-irrigated cropland and pasture. State figures come out at the end of July; county figures follow in August. When too few farms in a county answer, NASS combines that county with others and publishes one "other counties" figure, so some counties have no figure of their own.

Close this window.
Close this window.
Reconnecting…
One moment — we're restoring your session.