Farm & food prices · Production and land

Cash rent for pasture: Mille Lacs County, Minnesota

The average cash rent farmers paid per acre for pasture, from USDA's yearly cash rents survey.

Choose a place Show the figures for the place you chose.
Up to dateYearly. States at the end of July, counties in August. Last published Aug 21, 2026. Next expected August 2027.

The latest figures and how they have changed

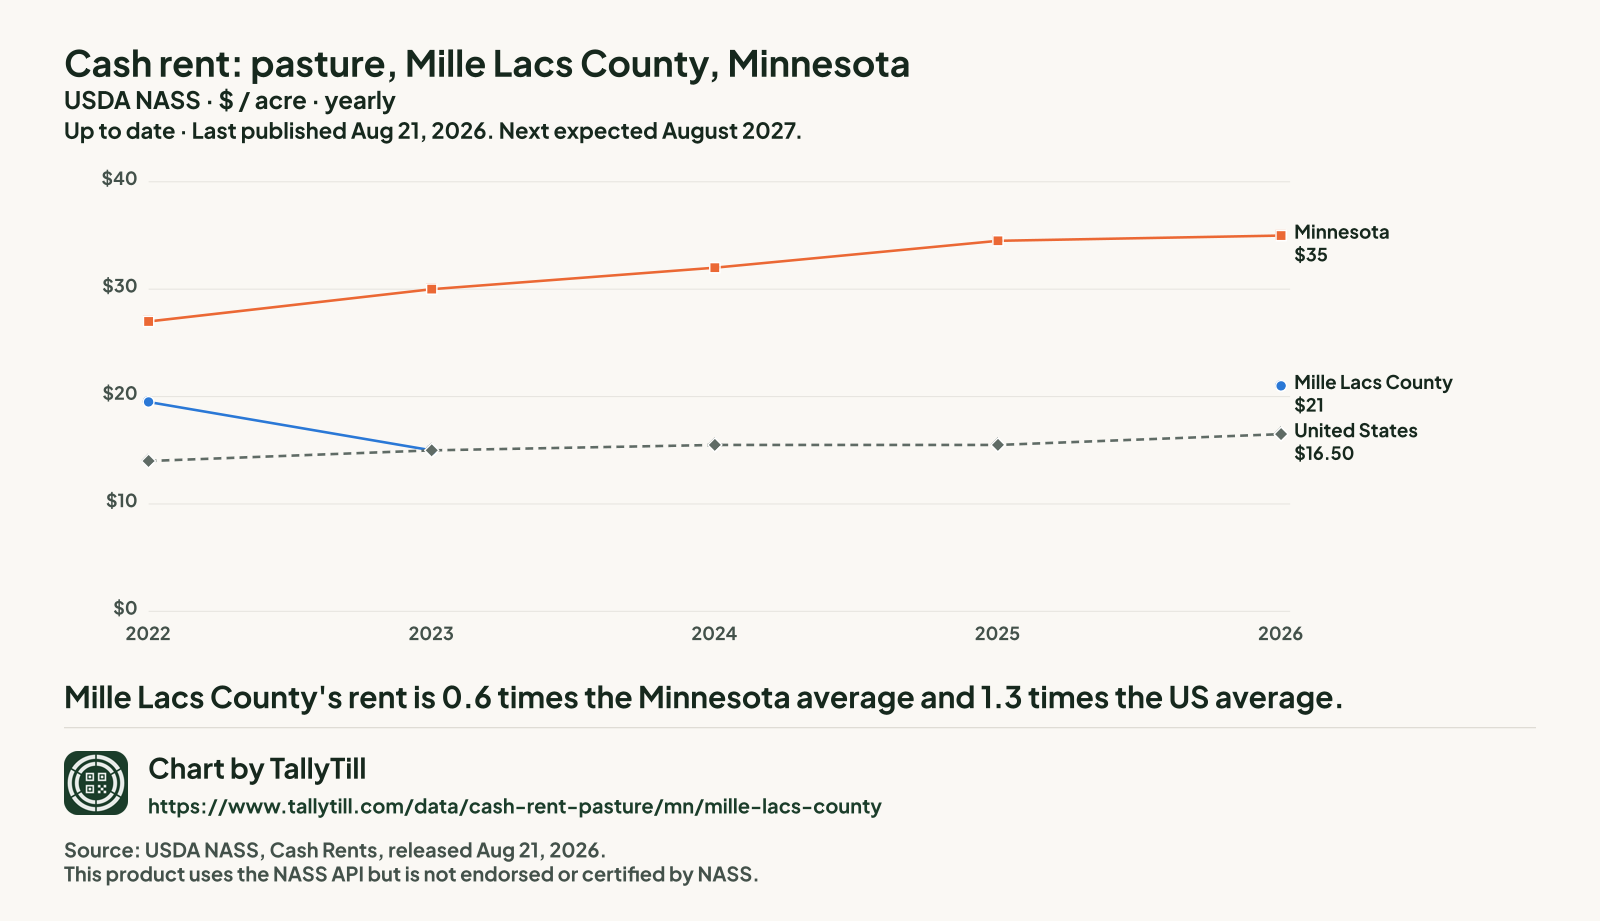
Mille Lacs County, 2026
$21 an acre
Up 40.0% from $15 in 2023
Minnesota, 2026
$35 an acre
Up 1.4% from $34.50 in 2025
United States, 2026
$16.50 an acre
Up 6.5% from $15.50 in 2025
Mille Lacs CountyMinnesotaUnited States
$0$10$20$30$4020222023202420252026Mille Lacs County$21Minnesota$35United States$16.50

Chart by TallyTill · tallytill.com

View the dataOpen every figure behind this chart in a table.Save imageSave this chart as a picture.

What the numbers say

  • Mille Lacs County's rent is 0.6 times the Minnesota average and 1.3 times the US average.
  • It is tied for the 10th lowest of the 50 Minnesota counties NASS published for 2026.
  • Since 2022 it has risen 7.7%, from $19.50 to $21 an acre.
  • Gaps are years with no separate Mille Lacs figure: in 2024 and 2025 NASS combined Mille Lacs into "other counties". Nothing is filled in.

Every figure behind this chart

Cash rent: pasture, dollars an acre
YearMille Lacs CountyMinnesotaUnited States
2026$21$35$16.50
2025Combined into "other counties"$34.50$15.50
2024Combined into "other counties"$32$15.50
2023$15$30$15
2022$19.50$27$14
Get a link and a preview picture of this chart to share. Get the code to show this chart on your own website.

Share this chart

FacebookShare this link on Facebook.XShare this link on X.LinkedInShare this link on LinkedIn.RedditShare this link on Reddit.PinterestShare this link on Pinterest.EmailEmail this link.Open the share menu on your device. Copy the link to your clipboard.

Embed this chart on your site

Copy the code to your clipboard.

The chart shows the latest figures TallyTill has collected and updates itself when a new release is collected. Keep the link under it: it credits the source and the explorer.

Every Minnesota county, 2026

Darker shading means a higher figure. Values run from $13 an acre in Carlton County to $70 an acre in Jackson County.

Aitkin County: $14.50 an acreAnoka County: combined into "other counties"Becker County: $26 an acreBeltrami County: $15 an acreBenton County: $27 an acreBig Stone County: combined into "other counties"Blue Earth County: combined into "other counties"Brown County: combined into "other counties"Carlton County: $13 an acreCarver County: $47.50 an acreCass County: $22.50 an acreChippewa County: combined into "other counties"Chisago County: $27.50 an acreClay County: combined into "other counties"Clearwater County: $19 an acreCook County: combined into "other counties"Cottonwood County: $52.50 an acreCrow Wing County: $15.50 an acreDakota County: $62.50 an acreDodge County: $42 an acreDouglas County: $35 an acreFaribault County: combined into "other counties"Fillmore County: $48.50 an acreFreeborn County: combined into "other counties"Goodhue County: $43.50 an acreGrant County: combined into "other counties"Hennepin County: combined into "other counties"Houston County: $40 an acreHubbard County: $18.50 an acreIsanti County: combined into "other counties"Itasca County: combined into "other counties"Jackson County: $70 an acreKanabec County: $20.50 an acreKandiyohi County: $63.50 an acreKittson County: combined into "other counties"Koochiching County: combined into "other counties"Lac qui Parle County: $39 an acreLake County: combined into "other counties"Lake of the Woods County: combined into "other counties"Le Sueur County: combined into "other counties"Lincoln County: $67 an acreLyon County: $55 an acreMcLeod County: combined into "other counties"Mahnomen County: $17.50 an acreMarshall County: $24.50 an acreMartin County: combined into "other counties"Meeker County: $45 an acreMille Lacs County: $21 an acreMorrison County: $19.50 an acreMower County: $39.50 an acreMurray County: $61.50 an acreNicollet County: combined into "other counties"Nobles County: $70 an acreNorman County: combined into "other counties"Olmsted County: $53.50 an acreOtter Tail County: $26.50 an acrePennington County: $22 an acrePine County: $21.50 an acrePipestone County: $68.50 an acrePolk County: $29 an acrePope County: $40.50 an acreRamsey County: combined into "other counties"Red Lake County: combined into "other counties"Redwood County: combined into "other counties"Renville County: $64.50 an acreRice County: combined into "other counties"Rock County: $68 an acreRoseau County: $21 an acreSt. Louis County: combined into "other counties"Scott County: combined into "other counties"Sherburne County: $36.50 an acreSibley County: combined into "other counties"Stearns County: $33.50 an acreSteele County: $39 an acreStevens County: combined into "other counties"Swift County: $42.50 an acreTodd County: combined into "other counties"Traverse County: combined into "other counties"Wabasha County: $54 an acreWadena County: combined into "other counties"Waseca County: combined into "other counties"Washington County: combined into "other counties"Watonwan County: combined into "other counties"Wilkin County: combined into "other counties"Winona County: $69.50 an acreWright County: $37.50 an acreYellow Medicine County: $57 an acreMille Lacs $21Mille Lacs $21
  • Under $21 (9 counties)
  • $21 to under $33.50 (11 counties)
  • $33.50 to under $42.50 (10 counties)
  • $42.50 to under $61.50 (10 counties)
  • $61.50 and over (10 counties)
  • Not published separately (37 counties, $29 an acre combined)

NASS combined Anoka County, Big Stone County, Blue Earth County, Brown County, Chippewa County, Clay County, Cook County, Faribault County, Freeborn County, Grant County, Hennepin County, Isanti County, Itasca County, Kittson County, Koochiching County, Lake County, Lake of the Woods County, Le Sueur County, Martin County, McLeod County, Nicollet County, Norman County, Ramsey County, Red Lake County, Redwood County, Rice County, Scott County, Sibley County, St. Louis County, Stevens County, Todd County, Traverse County, Wadena County, Waseca County, Washington County, Watonwan County and Wilkin County into "other counties", so they have no figure of their own.

Published Minnesota counties, highest first, 2026
Rank County Figure (dollars an acre) Precision (CV)
1 Jackson County $70 12.0%
1 Nobles County $70 7.4%
3 Winona County $69.50 6.6%
4 Pipestone County $68.50 4.1%
5 Rock County $68 17.3%
6 Lincoln County $67 8.0%
7 Renville County $64.50 5.2%
8 Kandiyohi County $63.50 7.9%
9 Dakota County $62.50 17.7%
10 Murray County $61.50 10.1%
11 Yellow Medicine County $57 9.5%
12 Lyon County $55 5.6%
13 Wabasha County $54 7.2%
14 Olmsted County $53.50 18.5%
15 Cottonwood County $52.50 9.4%
16 Fillmore County $48.50 10.4%
17 Carver County $47.50 5.1%
18 Meeker County $45 2.8%
19 Goodhue County $43.50 7.1%
20 Swift County $42.50 23.4%
21 Dodge County $42 5.2%
22 Pope County $40.50 6.2%
23 Houston County $40 3.8%
24 Mower County $39.50 4.3%
25 Lac qui Parle County $39 8.9%
25 Steele County $39 10.4%
27 Wright County $37.50 10.9%
28 Sherburne County $36.50 13.6%
29 Douglas County $35 19.6%
30 Stearns County $33.50 12.4%
31 Polk County $29 11.2%
32 Chisago County $27.50 10.4%
33 Benton County $27 4.9%
34 Otter Tail County $26.50 11.6%
35 Becker County $26 7.7%
36 Marshall County $24.50 6.7%
37 Cass County $22.50 5.0%
38 Pennington County $22 8.0%
39 Pine County $21.50 18.7%
40 Mille Lacs County This county $21 11.3%
40 Roseau County $21 8.6%
42 Kanabec County $20.50 13.1%
43 Morrison County $19.50 8.9%
44 Clearwater County $19 11.2%
45 Hubbard County $18.50 5.7%
46 Mahnomen County $17.50 13.4%
47 Crow Wing County $15.50 11.1%
48 Beltrami County $15 7.2%
49 Aitkin County $14.50 15.0%
50 Carlton County $13 11.8%
Source: USDA National Agricultural Statistics Service (NASS), Cash Rents Survey. County estimates released Aug 21, 2026; state and US estimates released Jul 31, 2026. Quick Stats item "RENT, CASH, PASTURELAND - EXPENSE, MEASURED IN $ / ACRE". Retrieved Oct 20, 2026; snapshot 2026-10-20.1. Precision: NASS's coefficient of variation for Mille Lacs is 11.3% (lower means more precise). Dollars as published, not adjusted for inflation. This product uses the NASS API but is not endorsed or certified by NASS.

What this measures

NASS asks farm operators what they pay in cash rent per acre, separately for irrigated cropland, non-irrigated cropland and pasture. State figures come out at the end of July; county figures follow in August. When too few farms in a county answer, NASS combines that county with others and publishes one "other counties" figure, so some counties have no figure of their own.

Close this window.
Close this window.
Reconnecting…
One moment — we're restoring your session.