Cash rent for pasture: Wabasha County, Minnesota
The average cash rent farmers paid per acre for pasture, from USDA's yearly cash rents survey.
The latest figures and how they have changed
 Chart by TallyTill · tallytill.com
What the numbers say
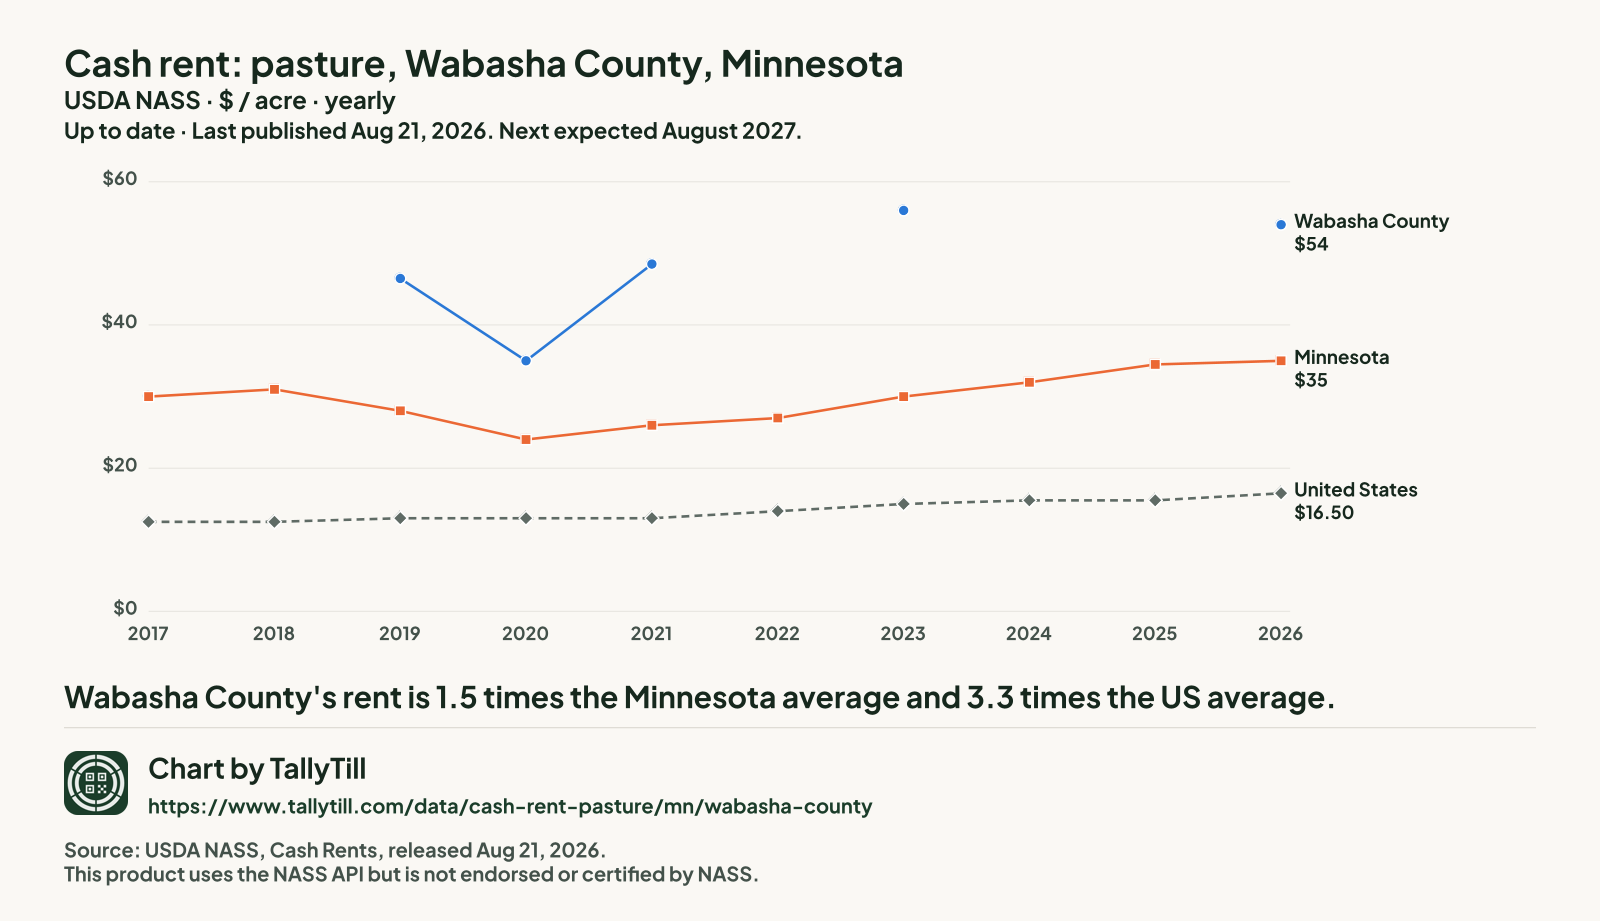
- Wabasha County's rent is 1.5 times the Minnesota average and 3.3 times the US average.
- It is the 13th highest of the 50 Minnesota counties NASS published for 2026.
- Since 2017 it has risen 80.0%, from $30 to $54 an acre.
- Gaps are years with no separate Wabasha figure: NASS ran no county survey in 2018, and in 2022, 2024 and 2025 it combined Wabasha into "other counties". Nothing is filled in.
Every figure behind this chart
| Year | Wabasha County | Minnesota | United States |
|---|---|---|---|
| 2026 | $54 | $35 | $16.50 |
| 2025 | Combined into "other counties" | $34.50 | $15.50 |
| 2024 | Combined into "other counties" | $32 | $15.50 |
| 2023 | $56 | $30 | $15 |
| 2022 | Combined into "other counties" | $27 | $14 |
| 2021 | $48.50 | $26 | $13 |
| 2020 | $35 | $24 | $13 |
| 2019 | $46.50 | $28 | $13 |
| 2018 | No county survey that year | $31 | $12.50 |
| 2017 | $30 | $30 | $12.50 |
Every Minnesota county, 2026
Darker shading means a higher figure. Values run from $13 an acre in Carlton County to $70 an acre in Jackson County.
- Under $21 (9 counties)
- $21 to under $33.50 (11 counties)
- $33.50 to under $42.50 (10 counties)
- $42.50 to under $61.50 (10 counties)
- $61.50 and over (10 counties)
- Not published separately (37 counties, $29 an acre combined)
NASS combined Anoka County, Big Stone County, Blue Earth County, Brown County, Chippewa County, Clay County, Cook County, Faribault County, Freeborn County, Grant County, Hennepin County, Isanti County, Itasca County, Kittson County, Koochiching County, Lake County, Lake of the Woods County, Le Sueur County, Martin County, McLeod County, Nicollet County, Norman County, Ramsey County, Red Lake County, Redwood County, Rice County, Scott County, Sibley County, St. Louis County, Stevens County, Todd County, Traverse County, Wadena County, Waseca County, Washington County, Watonwan County and Wilkin County into "other counties", so they have no figure of their own.
| Rank | County | Figure (dollars an acre) | Precision (CV) |
|---|---|---|---|
| 1 | Jackson County | $70 | 12.0% |
| 1 | Nobles County | $70 | 7.4% |
| 3 | Winona County | $69.50 | 6.6% |
| 4 | Pipestone County | $68.50 | 4.1% |
| 5 | Rock County | $68 | 17.3% |
| 6 | Lincoln County | $67 | 8.0% |
| 7 | Renville County | $64.50 | 5.2% |
| 8 | Kandiyohi County | $63.50 | 7.9% |
| 9 | Dakota County | $62.50 | 17.7% |
| 10 | Murray County | $61.50 | 10.1% |
| 11 | Yellow Medicine County | $57 | 9.5% |
| 12 | Lyon County | $55 | 5.6% |
| 13 | Wabasha County This county | $54 | 7.2% |
| 14 | Olmsted County | $53.50 | 18.5% |
| 15 | Cottonwood County | $52.50 | 9.4% |
| 16 | Fillmore County | $48.50 | 10.4% |
| 17 | Carver County | $47.50 | 5.1% |
| 18 | Meeker County | $45 | 2.8% |
| 19 | Goodhue County | $43.50 | 7.1% |
| 20 | Swift County | $42.50 | 23.4% |
| 21 | Dodge County | $42 | 5.2% |
| 22 | Pope County | $40.50 | 6.2% |
| 23 | Houston County | $40 | 3.8% |
| 24 | Mower County | $39.50 | 4.3% |
| 25 | Lac qui Parle County | $39 | 8.9% |
| 25 | Steele County | $39 | 10.4% |
| 27 | Wright County | $37.50 | 10.9% |
| 28 | Sherburne County | $36.50 | 13.6% |
| 29 | Douglas County | $35 | 19.6% |
| 30 | Stearns County | $33.50 | 12.4% |
| 31 | Polk County | $29 | 11.2% |
| 32 | Chisago County | $27.50 | 10.4% |
| 33 | Benton County | $27 | 4.9% |
| 34 | Otter Tail County | $26.50 | 11.6% |
| 35 | Becker County | $26 | 7.7% |
| 36 | Marshall County | $24.50 | 6.7% |
| 37 | Cass County | $22.50 | 5.0% |
| 38 | Pennington County | $22 | 8.0% |
| 39 | Pine County | $21.50 | 18.7% |
| 40 | Mille Lacs County | $21 | 11.3% |
| 40 | Roseau County | $21 | 8.6% |
| 42 | Kanabec County | $20.50 | 13.1% |
| 43 | Morrison County | $19.50 | 8.9% |
| 44 | Clearwater County | $19 | 11.2% |
| 45 | Hubbard County | $18.50 | 5.7% |
| 46 | Mahnomen County | $17.50 | 13.4% |
| 47 | Crow Wing County | $15.50 | 11.1% |
| 48 | Beltrami County | $15 | 7.2% |
| 49 | Aitkin County | $14.50 | 15.0% |
| 50 | Carlton County | $13 | 11.8% |
What this measures
NASS asks farm operators what they pay in cash rent per acre, separately for irrigated cropland, non-irrigated cropland and pasture. State figures come out at the end of July; county figures follow in August. When too few farms in a county answer, NASS combines that county with others and publishes one "other counties" figure, so some counties have no figure of their own.