Cash rent for pasture: Kemper County, Mississippi
The average cash rent farmers paid per acre for pasture, from USDA's yearly cash rents survey.
The latest figures and how they have changed
 Chart by TallyTill · tallytill.com
What the numbers say
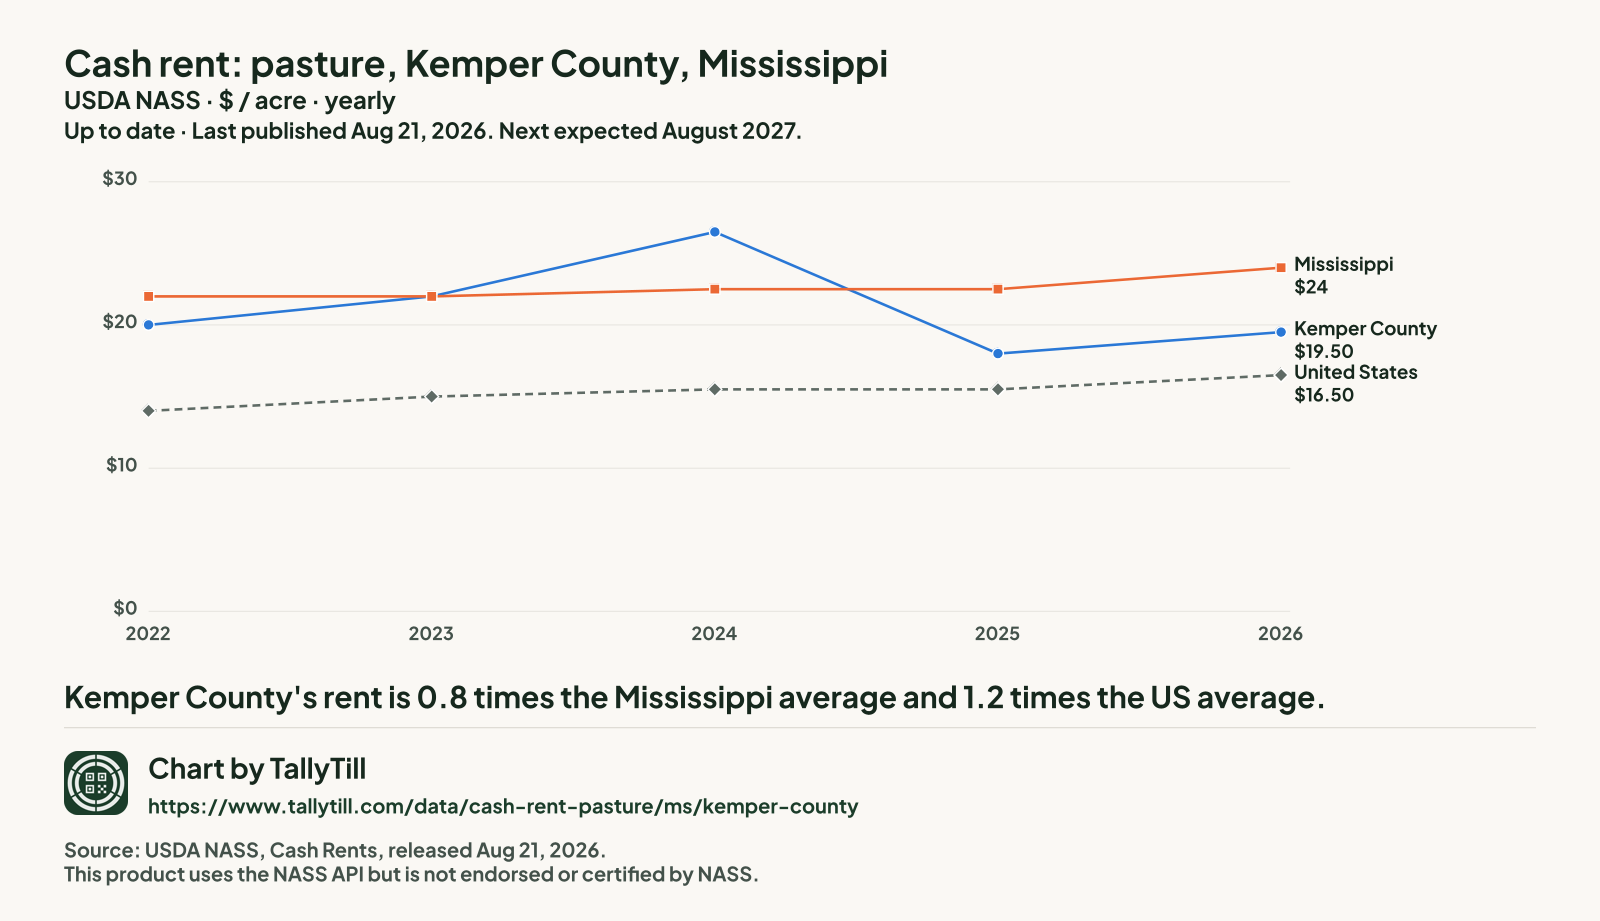
- Kemper County's rent is 0.8 times the Mississippi average and 1.2 times the US average.
- It is tied for the 21st lowest of the 53 Mississippi counties NASS published for 2026.
- Since 2022 it has fallen 2.5%, from $20 to $19.50 an acre.
Every figure behind this chart
| Year | Kemper County | Mississippi | United States |
|---|---|---|---|
| 2026 | $19.50 | $24 | $16.50 |
| 2025 | $18 | $22.50 | $15.50 |
| 2024 | $26.50 | $22.50 | $15.50 |
| 2023 | $22 | $22 | $15 |
| 2022 | $20 | $22 | $14 |
Every Mississippi county, 2026
Darker shading means a higher figure. Values run from $11 an acre in Tishomingo County to $32.50 an acre in Lincoln County.
- Under $16.50 (10 counties)
- $16.50 to under $19.50 (10 counties)
- $19.50 to under $22 (11 counties)
- $22 to under $27.50 (10 counties)
- $27.50 and over (12 counties)
- Not published separately (29 counties, $27 an acre combined)
NASS combined Adams County, Benton County, Bolivar County, Choctaw County, Coahoma County, Covington County, Forrest County, Franklin County, Greene County, Grenada County, Hancock County, Harrison County, Humphreys County, Issaquena County, Jackson County, Jefferson Davis County, Lauderdale County, Leflore County, Monroe County, Perry County, Quitman County, Scott County, Sharkey County, Simpson County, Sunflower County, Tallahatchie County, Warren County, Washington County and Wilkinson County into "other counties", so they have no figure of their own.
| Rank | County | Figure (dollars an acre) | Precision (CV) |
|---|---|---|---|
| 1 | Lincoln County | $32.50 | 5.4% |
| 2 | Marshall County | $32 | 13.7% |
| 3 | Copiah County | $31 | 11.8% |
| 4 | George County | $30.50 | 8.5% |
| 5 | Jefferson County | $30 | 12.0% |
| 6 | Oktibbeha County | $29 | 14.8% |
| 6 | Panola County | $29 | 16.1% |
| 8 | Pike County | $28.50 | 9.0% |
| 9 | Rankin County | $28 | 7.2% |
| 9 | Yazoo County | $28 | 3.5% |
| 11 | Noxubee County | $27.50 | 6.0% |
| 11 | Pearl River County | $27.50 | 4.6% |
| 13 | Chickasaw County | $26 | 7.2% |
| 14 | Newton County | $25 | 6.5% |
| 14 | Tippah County | $25 | 12.5% |
| 16 | Holmes County | $23 | 5.7% |
| 16 | Marion County | $23 | 17.2% |
| 18 | Hinds County | $22.50 | 5.7% |
| 18 | Lamar County | $22.50 | 3.6% |
| 18 | Lowndes County | $22.50 | 5.1% |
| 21 | Attala County | $22 | 7.8% |
| 21 | Prentiss County | $22 | 5.6% |
| 23 | Madison County | $21.50 | 9.8% |
| 23 | Smith County | $21.50 | 5.6% |
| 23 | Walthall County | $21.50 | 6.1% |
| 23 | Wayne County | $21.50 | 7.2% |
| 27 | Amite County | $21 | 7.5% |
| 27 | Carroll County | $21 | 12.8% |
| 29 | Alcorn County | $20.50 | 7.0% |
| 30 | Neshoba County | $20 | 7.3% |
| 31 | Kemper County This county | $19.50 | 5.8% |
| 31 | Leake County | $19.50 | 16.8% |
| 31 | Lee County | $19.50 | 7.7% |
| 34 | Clarke County | $18.50 | 5.6% |
| 34 | De Soto County | $18.50 | 11.5% |
| 34 | Montgomery County | $18.50 | 10.7% |
| 34 | Stone County | $18.50 | 10.3% |
| 38 | Clay County | $18 | 6.0% |
| 39 | Calhoun County | $17 | 18.6% |
| 39 | Tunica County | $17 | 7.5% |
| 39 | Winston County | $17 | 5.8% |
| 42 | Claiborne County | $16.50 | 6.9% |
| 42 | Jones County | $16.50 | 3.1% |
| 44 | Pontotoc County | $16 | 7.3% |
| 44 | Tate County | $16 | 4.0% |
| 46 | Itawamba County | $15.50 | 6.9% |
| 46 | Union County | $15.50 | 5.1% |
| 48 | Lafayette County | $15 | 4.2% |
| 48 | Yalobusha County | $15 | 6.3% |
| 50 | Lawrence County | $14.50 | 8.6% |
| 51 | Jasper County | $13.50 | 12.4% |
| 52 | Webster County | $13 | 5.5% |
| 53 | Tishomingo County | $11 | 9.0% |
What this measures
NASS asks farm operators what they pay in cash rent per acre, separately for irrigated cropland, non-irrigated cropland and pasture. State figures come out at the end of July; county figures follow in August. When too few farms in a county answer, NASS combines that county with others and publishes one "other counties" figure, so some counties have no figure of their own.