Cash rent for pasture: Wilkes County, North Carolina
The average cash rent farmers paid per acre for pasture, from USDA's yearly cash rents survey.
The latest figures and how they have changed
 Chart by TallyTill · tallytill.com
What the numbers say
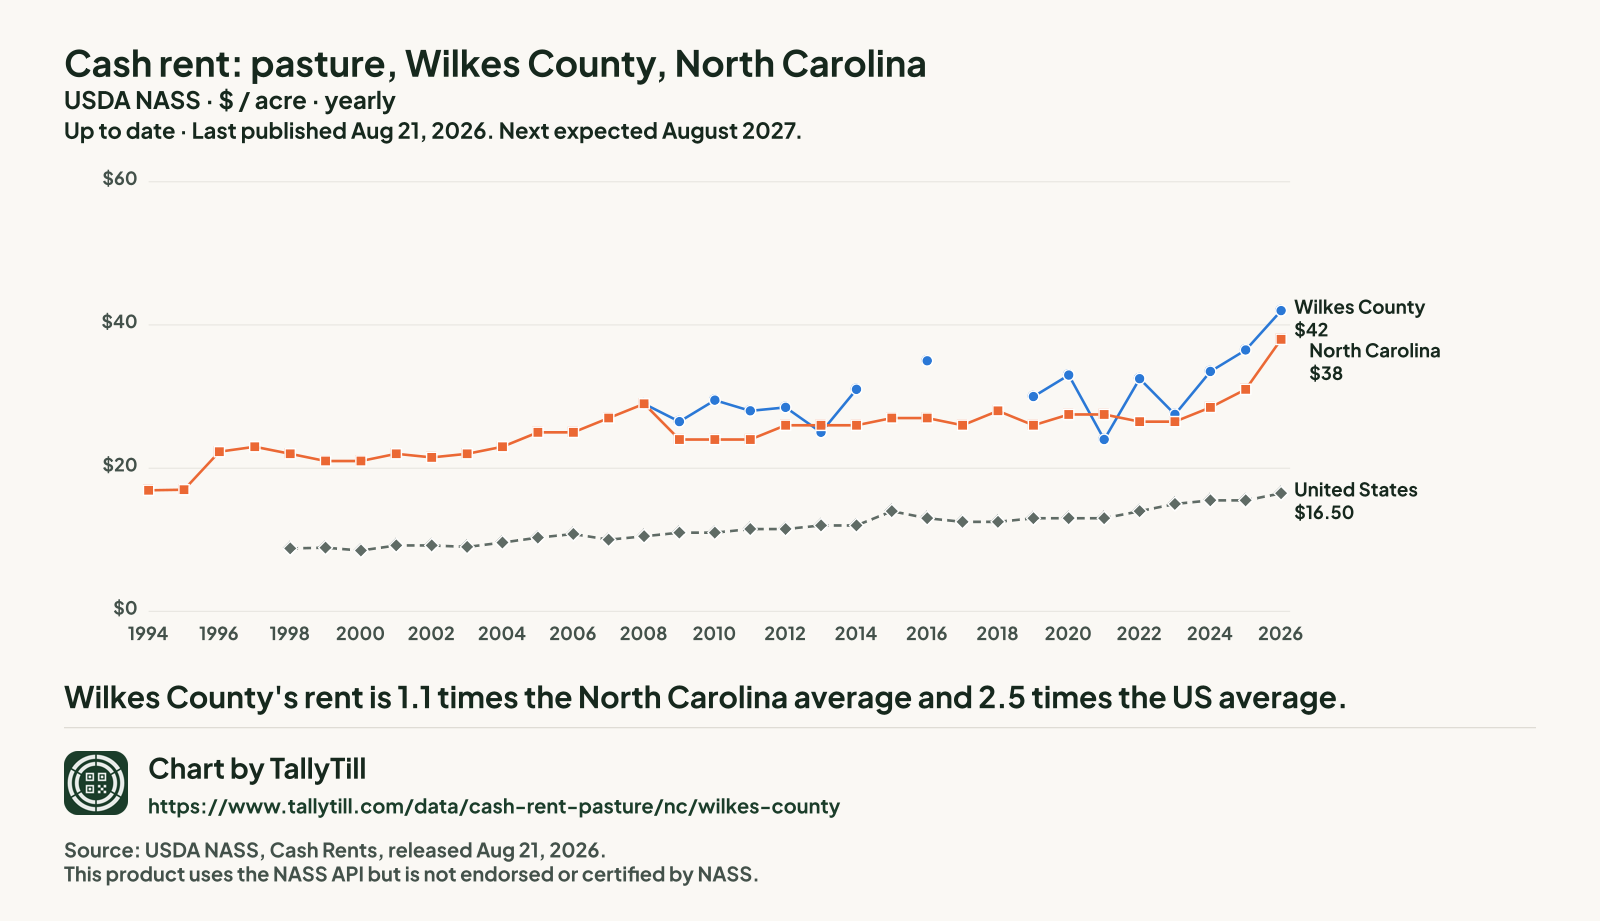
- Wilkes County's rent is 1.1 times the North Carolina average and 2.5 times the US average.
- It is tied for the 16th highest of the 51 North Carolina counties NASS published for 2026.
- Since 2008 it has risen 44.8%, from $29 to $42 an acre.
- Gaps are years with no separate Wilkes figure: NASS ran no county survey in 2015 or 2018, and in 2017 it combined Wilkes into "other counties". Nothing is filled in.
Every figure behind this chart
| Year | Wilkes County | North Carolina | United States |
|---|---|---|---|
| 2026 | $42 | $38 | $16.50 |
| 2025 | $36.50 | $31 | $15.50 |
| 2024 | $33.50 | $28.50 | $15.50 |
| 2023 | $27.50 | $26.50 | $15 |
| 2022 | $32.50 | $26.50 | $14 |
| 2021 | $24 | $27.50 | $13 |
| 2020 | $33 | $27.50 | $13 |
| 2019 | $30 | $26 | $13 |
| 2018 | No county survey that year | $28 | $12.50 |
| 2017 | Combined into "other counties" | $26 | $12.50 |
| 2016 | $35 | $27 | $13 |
| 2015 | No county survey that year | $27 | $14 |
| 2014 | $31 | $26 | $12 |
| 2013 | $25 | $26 | $12 |
| 2012 | $28.50 | $26 | $11.50 |
| 2011 | $28 | $24 | $11.50 |
| 2010 | $29.50 | $24 | $11 |
| 2009 | $26.50 | $24 | $11 |
| 2008 | $29 | $29 | $10.50 |
| 2007 | No figure | $27 | $10 |
| 2006 | No figure | $25 | $10.80 |
| 2005 | No figure | $25 | $10.30 |
| 2004 | No figure | $23 | $9.60 |
| 2003 | No figure | $22 | $9 |
| 2002 | No figure | $21.50 | $9.20 |
| 2001 | No figure | $22 | $9.20 |
| 2000 | No figure | $21 | $8.50 |
| 1999 | No figure | $21 | $8.90 |
| 1998 | No figure | $22 | $8.80 |
| 1997 | No figure | $23 | No figure |
| 1996 | No figure | $22.30 | No figure |
| 1995 | No figure | $17 | No figure |
| 1994 | No figure | $16.90 | No figure |
Every North Carolina county, 2026
Darker shading means a higher figure. Values run from $15 an acre in Rockingham County to $58.50 an acre in Wayne County.
- Under $28 (10 counties)
- $28 to under $32.50 (10 counties)
- $32.50 to under $36 (9 counties)
- $36 to under $48.50 (11 counties)
- $48.50 and over (11 counties)
- Not published separately (49 counties, $35 an acre combined)
NASS combined Avery County, Beaufort County, Bertie County, Bladen County, Brunswick County, Burke County, Camden County, Carteret County, Cherokee County, Chowan County, Clay County, Craven County, Cumberland County, Currituck County, Dare County, Durham County, Edgecombe County, Forsyth County, Gates County, Graham County, Granville County, Haywood County, Henderson County, Hertford County, Hoke County, Hyde County, Jackson County, Lenoir County, Macon County, Martin County, McDowell County, Montgomery County, New Hanover County, Northampton County, Onslow County, Pamlico County, Pasquotank County, Pender County, Perquimans County, Pitt County, Polk County, Richmond County, Robeson County, Scotland County, Transylvania County, Tyrrell County, Vance County, Washington County and Wilson County into "other counties", so they have no figure of their own.
| Rank | County | Figure (dollars an acre) | Precision (CV) |
|---|---|---|---|
| 1 | Wayne County | $58.50 | 9.0% |
| 2 | Yadkin County | $57.50 | 5.9% |
| 3 | Greene County | $56.50 | 11.1% |
| 4 | Union County | $54.50 | 8.0% |
| 5 | Jones County | $52 | 10.0% |
| 6 | Anson County | $51 | 8.5% |
| 6 | Duplin County | $51 | 8.6% |
| 8 | Sampson County | $50 | 6.4% |
| 9 | Alexander County | $49 | 5.8% |
| 9 | Alleghany County | $49 | 6.9% |
| 11 | Harnett County | $48.50 | 7.3% |
| 12 | Wake County | $48 | 7.9% |
| 13 | Columbus County | $47 | 6.8% |
| 13 | Halifax County | $47 | 7.0% |
| 15 | Iredell County | $44 | 5.7% |
| 16 | Person County | $42 | 6.5% |
| 16 | Wilkes County This county | $42 | 4.3% |
| 18 | Lincoln County | $41 | 5.6% |
| 19 | Chatham County | $40 | 5.4% |
| 20 | Mecklenburg County | $37.50 | 14.3% |
| 21 | Randolph County | $36 | 4.7% |
| 21 | Watauga County | $36 | 13.9% |
| 23 | Catawba County | $35 | 8.3% |
| 23 | Mitchell County | $35 | 8.0% |
| 23 | Orange County | $35 | 6.0% |
| 26 | Cleveland County | $34.50 | 3.1% |
| 26 | Nash County | $34.50 | 9.6% |
| 26 | Surry County | $34.50 | 6.7% |
| 29 | Davie County | $33 | 6.7% |
| 30 | Ashe County | $32.50 | 22.5% |
| 30 | Franklin County | $32.50 | 13.7% |
| 32 | Johnston County | $32 | 8.5% |
| 32 | Lee County | $32 | 15.2% |
| 34 | Stanly County | $31 | 11.9% |
| 35 | Rowan County | $30.50 | 24.0% |
| 36 | Buncombe County | $30 | 8.4% |
| 36 | Warren County | $30 | 5.1% |
| 38 | Alamance County | $29 | 12.6% |
| 38 | Caldwell County | $29 | 5.2% |
| 40 | Guilford County | $28.50 | 16.2% |
| 41 | Moore County | $28 | 6.1% |
| 42 | Madison County | $25 | 10.4% |
| 42 | Stokes County | $25 | 4.5% |
| 44 | Rutherford County | $24 | 10.8% |
| 45 | Cabarrus County | $23 | 9.9% |
| 46 | Davidson County | $22.50 | 7.5% |
| 47 | Caswell County | $21.50 | 6.4% |
| 48 | Gaston County | $20 | 17.4% |
| 49 | Yancey County | $17.50 | 6.8% |
| 50 | Rockingham County | $15 | 14.6% |
| 50 | Swain County | $15 | 15.8% |
What this measures
NASS asks farm operators what they pay in cash rent per acre, separately for irrigated cropland, non-irrigated cropland and pasture. State figures come out at the end of July; county figures follow in August. When too few farms in a county answer, NASS combines that county with others and publishes one "other counties" figure, so some counties have no figure of their own.