Chicken breast: what a pound costs in the Northeast
The average price shoppers paid in urban stores each month, from the U.S. Bureau of Labor Statistics.
The latest figures and how they have changed
Price of a pound, each month
 Chart by TallyTill · tallytill.com
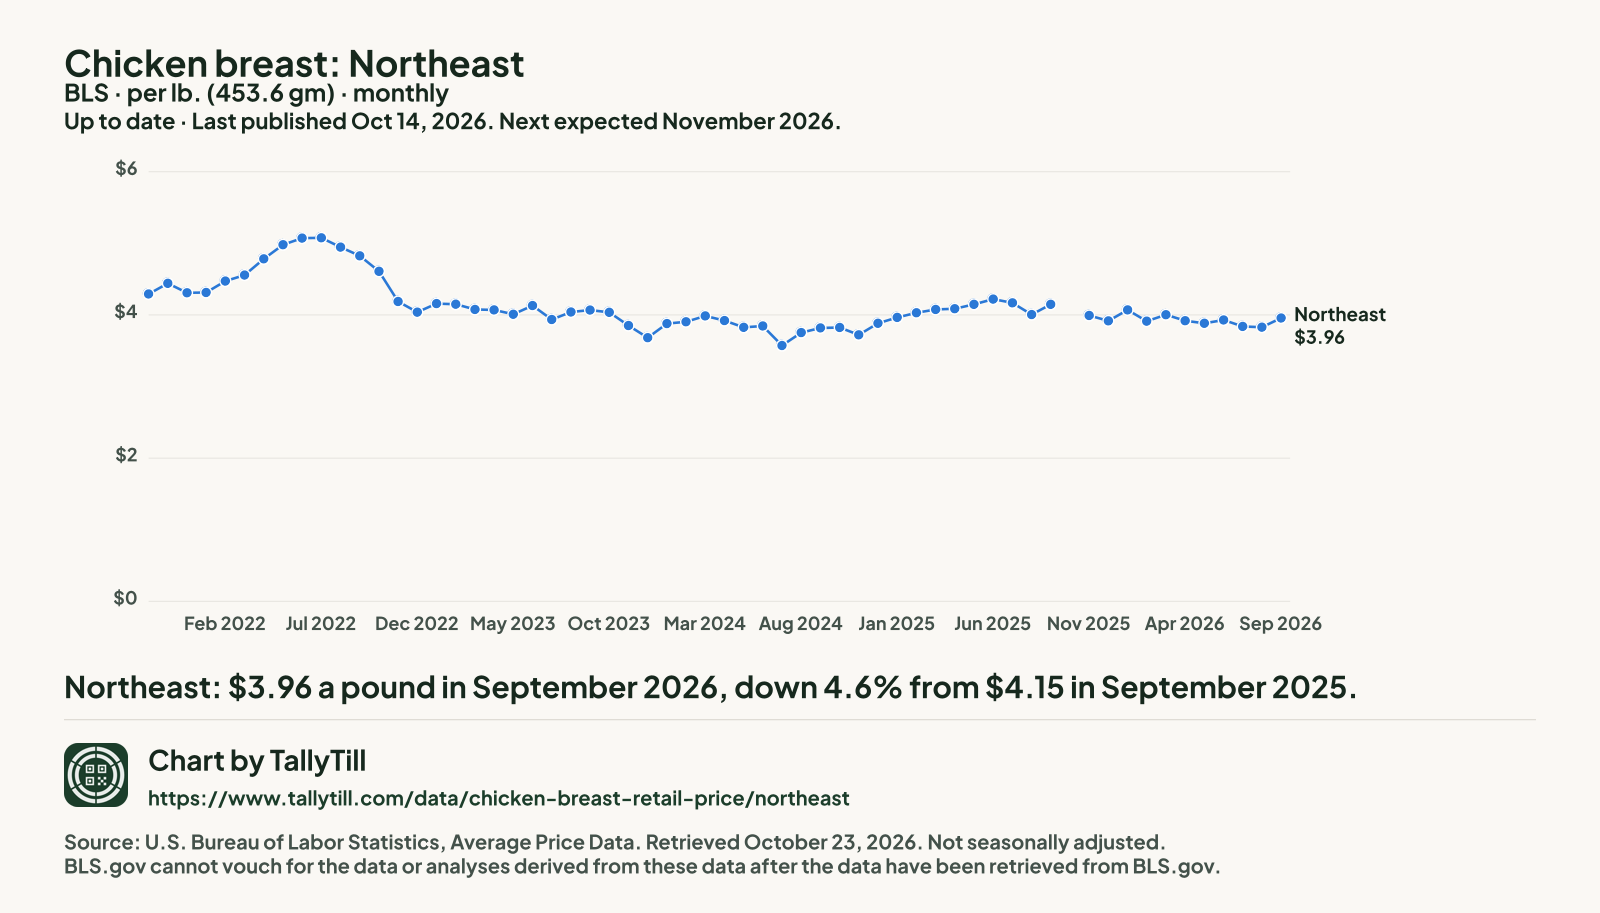
Northeast: $3.96 a pound in September 2026.
What the numbers say
- Northeast's average retail price is 0.9 times the US average.
- Since October 2021 it has fallen 7.8%, from $4.29 to $3.96 a pound.
- Gaps are months with no Northeast figure: BLS never collected the figure in October 2025 (federal shutdown). Nothing is filled in.
The line breaks at October 2025: BLS collected no prices that month (the 2025 lapse in appropriations).
Chicken breast: the figures
Dollars a pound, as BLS publishes them, newest first.
| Month | Northeast |
|---|---|
| Sep 2026 | $3.957 |
| Aug 2026 | $3.829 |
| Jul 2026 | $3.839 |
| Jun 2026 | $3.930 |
| May 2026 | $3.884 |
| Apr 2026 | $3.918 |
| Mar 2026 | $4.002 |
| Feb 2026 | $3.913 |
| Jan 2026 | $4.069 |
| Dec 2025 | $3.916 |
| Nov 2025 | $3.992 |
| Oct 2025 | Not collected |
| Sep 2025 | $4.148 |
| Aug 2025 | $4.004 |
| Jul 2025 | $4.168 |
| Jun 2025 | $4.220 |
| May 2025 | $4.147 |
| Apr 2025 | $4.087 |
| Mar 2025 | $4.076 |
| Feb 2025 | $4.030 |
| Jan 2025 | $3.966 |
| Dec 2024 | $3.883 |
| Nov 2024 | $3.722 |
| Oct 2024 | $3.824 |
| Sep 2024 | $3.819 |
| Aug 2024 | $3.754 |
| Jul 2024 | $3.572 |
| Jun 2024 | $3.845 |
| May 2024 | $3.826 |
| Apr 2024 | $3.920 |
| Mar 2024 | $3.986 |
| Feb 2024 | $3.904 |
| Jan 2024 | $3.878 |
| Dec 2023 | $3.682 |
| Nov 2023 | $3.851 |
| Oct 2023 | $4.037 |
| Sep 2023 | $4.067 |
| Aug 2023 | $4.040 |
| Jul 2023 | $3.935 |
| Jun 2023 | $4.131 |
| May 2023 | $4.010 |
| Apr 2023 | $4.070 |
| Mar 2023 | $4.076 |
| Feb 2023 | $4.149 |
| Jan 2023 | $4.157 |
| Dec 2022 | $4.038 |
| Nov 2022 | $4.188 |
| Oct 2022 | $4.609 |
| Sep 2022 | $4.826 |
| Aug 2022 | $4.946 |
| Jul 2022 | $5.076 |
| Jun 2022 | $5.072 |
| May 2022 | $4.980 |
| Apr 2022 | $4.784 |
| Mar 2022 | $4.556 |
| Feb 2022 | $4.472 |
| Jan 2022 | $4.313 |
| Dec 2021 | $4.309 |
| Nov 2021 | $4.441 |
| Oct 2021 | $4.292 |
The line breaks at October 2025: BLS collected no prices that month (the 2025 lapse in appropriations). This table shows the last 10 years. The CSV holds every month.
By region
The four Census regions, urban areas, last 5 years. Every panel uses the same scale, so heights compare directly.
Chart by TallyTill · tallytill.com
September 2026: Northeast $3.96, Midwest $3.84, South $4.15, West $4.74, a pound.

Chicken breast: the regional figures
Dollars a pound, as BLS publishes them, newest first.
| Month | US city average | Northeast | Midwest | South | West |
|---|---|---|---|---|---|
| Sep 2026 | $4.203 | $3.957 | $3.840 | $4.146 | $4.739 |
| Aug 2026 | $4.173 | $3.829 | $3.915 | $4.139 | $4.718 |
| Jul 2026 | $4.153 | $3.839 | $3.923 | $4.105 | $4.652 |
| Jun 2026 | $4.181 | $3.930 | $3.980 | $4.128 | $4.605 |
| May 2026 | $4.171 | $3.884 | $4.172 | $3.970 | $4.668 |
| Apr 2026 | $4.168 | $3.918 | $4.097 | $3.867 | $4.816 |
| Mar 2026 | $4.172 | $4.002 | $4.067 | $3.918 | $4.706 |
| Feb 2026 | $4.142 | $3.913 | $4.009 | $3.872 | $4.781 |
| Jan 2026 | $4.165 | $4.069 | $3.988 | $3.792 | $4.853 |
| Dec 2025 | $4.153 | $3.916 | $4.081 | $3.897 | $4.726 |
| Nov 2025 | $4.150 | $3.992 | $4.079 | $3.762 | $4.907 |
| Oct 2025 | Not collected | Not collected | Not collected | Not collected | Not collected |
| Sep 2025 | $4.172 | $4.148 | $4.324 | $3.628 | $5.119 |
| Aug 2025 | $4.212 | $4.004 | $4.343 | $3.695 | $5.324 |
| Jul 2025 | $4.204 | $4.168 | $4.355 | $3.717 | $5.059 |
| Jun 2025 | $4.239 | $4.220 | $4.451 | $3.719 | $5.084 |
| May 2025 | $4.216 | $4.147 | $4.403 | $3.702 | $5.100 |
| Apr 2025 | $4.180 | $4.087 | $4.536 | $3.587 | $5.221 |
| Mar 2025 | $4.160 | $4.076 | $4.507 | $3.626 | $5.090 |
| Feb 2025 | $4.079 | $4.030 | $4.342 | $3.563 | $4.993 |
| Jan 2025 | $3.969 | $3.966 | $4.329 | $3.405 | $4.869 |
| Dec 2024 | $4.104 | $3.883 | $4.385 | $3.645 | $5.070 |
| Nov 2024 | $4.011 | $3.722 | $4.489 | $3.500 | $5.080 |
| Oct 2024 | $4.037 | $3.824 | $4.395 | $3.583 | $5.193 |
| Sep 2024 | $3.974 | $3.819 | $4.446 | $3.523 | $4.802 |
| Aug 2024 | $3.952 | $3.754 | $4.310 | $3.472 | $4.952 |
| Jul 2024 | $3.946 | $3.572 | $4.486 | $3.593 | $4.729 |
| Jun 2024 | $4.046 | $3.845 | $4.647 | $3.666 | $4.649 |
| May 2024 | $4.118 | $3.826 | $4.594 | $3.744 | $4.906 |
| Apr 2024 | $4.061 | $3.920 | $4.705 | $3.668 | $4.590 |
| Mar 2024 | $4.106 | $3.986 | $4.943 | $3.593 | $4.733 |
| Feb 2024 | $4.105 | $3.904 | $4.832 | $3.687 | $4.705 |
| Jan 2024 | $4.086 | $3.878 | $5.044 | $3.606 | $4.650 |
| Dec 2023 | $4.082 | $3.682 | $4.911 | $3.688 | $4.718 |
| Nov 2023 | $4.060 | $3.851 | $4.739 | $3.576 | $4.795 |
| Oct 2023 | $4.222 | $4.037 | $4.486 | $3.808 | $5.064 |
| Sep 2023 | $4.229 | $4.067 | $4.412 | $3.809 | $5.145 |
| Aug 2023 | $4.179 | $4.040 | $4.575 | $3.694 | $5.033 |
| Jul 2023 | $4.141 | $3.935 | $4.623 | $3.671 | $4.926 |
| Jun 2023 | $4.193 | $4.131 | $4.492 | $3.729 | $5.008 |
| May 2023 | $4.236 | $4.010 | $4.512 | $3.859 | $5.014 |
| Apr 2023 | $4.405 | $4.070 | $5.181 | $3.851 | $5.008 |
| Mar 2023 | $4.324 | $4.076 | $5.098 | $3.792 | $4.790 |
| Feb 2023 | $4.365 | $4.149 | $5.151 | $3.765 | $4.920 |
| Jan 2023 | $4.315 | $4.157 | $4.994 | $3.730 | $4.900 |
| Dec 2022 | $4.348 | $4.038 | $5.128 | $3.786 | $4.824 |
| Nov 2022 | $4.420 | $4.188 | $5.175 | $3.799 | $4.961 |
| Oct 2022 | $4.670 | $4.609 | $5.281 | $4.061 | $5.124 |
| Sep 2022 | $4.746 | $4.826 | $5.333 | $4.071 | $5.189 |
| Aug 2022 | $4.706 | $4.946 | $5.370 | $4.060 | $4.938 |
| Jul 2022 | $4.608 | $5.076 | $5.384 | $3.769 | $4.846 |
| Jun 2022 | $4.568 | $5.072 | $5.137 | $3.725 | $4.999 |
| May 2022 | $4.310 | $4.980 | $4.734 | $3.555 | $4.543 |
| Apr 2022 | $4.096 | $4.784 | $4.083 | $3.548 | $4.454 |
| Mar 2022 | $3.870 | $4.556 | $3.935 | $3.163 | $4.407 |
| Feb 2022 | $3.815 | $4.472 | $3.710 | $3.212 | $4.409 |
| Jan 2022 | $3.726 | $4.313 | $3.601 | $3.168 | $4.317 |
| Dec 2021 | $3.725 | $4.309 | $3.575 | $3.153 | $4.362 |
| Nov 2021 | $3.618 | $4.441 | $3.480 | $3.172 | $3.828 |
| Oct 2021 | $3.589 | $4.292 | $3.514 | $3.187 | $3.730 |
| Sep 2021 | $3.517 | $4.198 | $3.402 | $3.119 | $3.671 |
| Aug 2021 | $3.536 | $4.242 | $3.124 | $3.365 | $3.619 |
| Jul 2021 | $3.500 | $4.039 | $3.368 | $3.261 | $3.539 |
| Jun 2021 | $3.353 | $4.002 | $3.184 | $3.029 | $3.469 |
| May 2021 | $3.371 | $4.022 | $3.224 | $2.961 | $3.632 |
| Apr 2021 | $3.406 | $3.929 | $3.193 | $3.082 | $3.709 |
| Mar 2021 | $3.291 | $3.691 | $2.999 | $3.024 | $3.764 |
| Feb 2021 | $3.239 | $3.613 | $2.985 | $2.977 | $3.679 |
| Jan 2021 | $3.260 | $3.533 | $3.102 | $3.048 | $3.608 |
| Dec 2020 | $3.293 | $3.617 | $3.086 | $3.132 | $3.545 |
| Nov 2020 | $3.412 | $3.557 | $3.352 | $3.324 | $3.508 |
| Oct 2020 | $3.290 | $3.402 | $3.347 | $3.106 | $3.472 |
| Sep 2020 | $3.302 | $3.362 | $3.299 | $3.173 | $3.502 |
| Aug 2020 | $3.276 | $3.312 | $3.361 | $3.097 | $3.485 |
| Jul 2020 | $3.221 | $3.462 | $3.310 | $2.938 | $3.422 |
| Jun 2020 | $3.349 | $3.572 | $3.387 | $3.163 | $3.442 |
| May 2020 | $3.348 | Not collected | $3.352 | $3.145 | Not collected |
| Apr 2020 | $3.158 | $3.458 | $2.902 | $3.091 | Not collected |
| Mar 2020 | $2.956 | $3.318 | $2.511 | $2.911 | $3.349 |
| Feb 2020 | $3.013 | $3.184 | $2.862 | $2.905 | $3.282 |
| Jan 2020 | $3.059 | $3.219 | $3.002 | $2.869 | $3.361 |
| Dec 2019 | $3.113 | $3.262 | $3.050 | $2.975 | $3.314 |
| Nov 2019 | $2.940 | $3.115 | $2.652 | $2.891 | $3.285 |
| Oct 2019 | $2.948 | $3.276 | $2.644 | $2.818 | $3.299 |
| Sep 2019 | $2.930 | $3.295 | $2.607 | $2.836 | $3.177 |
| Aug 2019 | $2.960 | $3.177 | $2.656 | $2.919 | $3.235 |
| Jul 2019 | $2.975 | $3.274 | $2.641 | $2.954 | $3.184 |
| Jun 2019 | $3.051 | $3.283 | $2.999 | $2.889 | $3.137 |
| May 2019 | $3.092 | $3.485 | $2.977 | $2.943 | $3.138 |
| Apr 2019 | $3.014 | $3.042 | $2.966 | $2.943 | $3.173 |
| Mar 2019 | $3.048 | $3.266 | $2.971 | $2.962 | $3.117 |
| Feb 2019 | $3.062 | $3.362 | $2.983 | $2.978 | $3.072 |
| Jan 2019 | $3.063 | $3.455 | $2.944 | $2.961 | $3.084 |
| Dec 2018 | $3.112 | $3.420 | $3.051 | $2.986 | $3.157 |
| Nov 2018 | $3.052 | $3.261 | $3.001 | $2.955 | $3.111 |
| Oct 2018 | $3.047 | $3.282 | $2.929 | $2.978 | $3.133 |
| Sep 2018 | $2.896 | $3.255 | $2.515 | $2.946 | $3.058 |
| Aug 2018 | $2.939 | $3.452 | $2.471 | $2.976 | $3.117 |
| Jul 2018 | $3.116 | $3.389 | $3.120 | $2.986 | $3.102 |
| Jun 2018 | $3.094 | $3.299 | $3.104 | $2.996 | $3.073 |
| May 2018 | $3.076 | $3.471 | $3.025 | $2.942 | $3.056 |
| Apr 2018 | $3.238 | $3.434 | $3.464 | $2.885 | $3.367 |
| Mar 2018 | $3.142 | $3.384 | $3.261 | $2.941 | $3.153 |
| Feb 2018 | $3.119 | $3.363 | $3.257 | $2.926 | $3.090 |
| Jan 2018 | $3.073 | $2.974 | $3.291 | $2.860 | $3.133 |
| Dec 2017 | $3.192 | $3.729 | $3.187 | $2.947 | $3.091 |
| Nov 2017 | $3.130 | $3.676 | $3.208 | $2.886 | $2.984 |
| Oct 2017 | $3.141 | $3.708 | $3.029 | $2.873 | $3.216 |
| Sep 2017 | $3.185 | $3.529 | $3.109 | $2.949 | $3.357 |
| Aug 2017 | $3.194 | $3.506 | $3.148 | $3.028 | $3.246 |
| Jul 2017 | $3.189 | $3.540 | $3.161 | $2.981 | $3.253 |
| Jun 2017 | $3.215 | $3.585 | $3.070 | $2.996 | $3.412 |
| May 2017 | $3.208 | $3.564 | $3.090 | $3.042 | $3.289 |
| Apr 2017 | $3.289 | $3.668 | $3.169 | $3.180 | $3.240 |
| Mar 2017 | $3.291 | $3.650 | $3.175 | $3.209 | $3.219 |
| Feb 2017 | $3.195 | $3.457 | $3.084 | $3.163 | $3.136 |
| Jan 2017 | $3.218 | $3.510 | $3.098 | $3.191 | $3.138 |
| Dec 2016 | $3.200 | $3.483 | $3.001 | $3.123 | $3.279 |
| Nov 2016 | $3.263 | $3.652 | $2.939 | $3.131 | $3.469 |
| Oct 2016 | $3.305 | $3.619 | $3.039 | $3.139 | $3.525 |
This table shows the last 10 years. The CSV holds every month.
BLS.gov cannot vouch for the data or analyses derived from these data after the data have been retrieved from BLS.gov. BLS series APU0000FF1101, APU0100FF1101, APU0200FF1101, APU0300FF1101, APU0400FF1101, average price in urban areas. BLS data are in the public domain.
What this measures
It is BLS's average of the prices its staff record in stores in urban areas, for one item of a set size. BLS says these averages are best for the price level in a month, not for price change over time.