Farm & food prices · Prices farmers receive
Corn for grain: price received: Louisiana
The average price farmers received per bushel for corn for grain each month, from USDA's monthly agricultural prices survey.
Up to dateMonthly. USDA usually publishes at the end of each month. Last published Sep 29, 2026. Next expected October 2026.
The latest figures and how they have changed
Louisiana, August 2019
$4.05 a bushel
Up 4.4% from $3.88 in May 2019
United States, August 2026
$4.45 a bushel
Up 4.5% from $4.26 in July 2026
LouisianaUnited States
 Chart by TallyTill · tallytill.com
View the dataOpen every figure behind this chart in a table.Save imageSave this chart as a picture.
What the numbers say
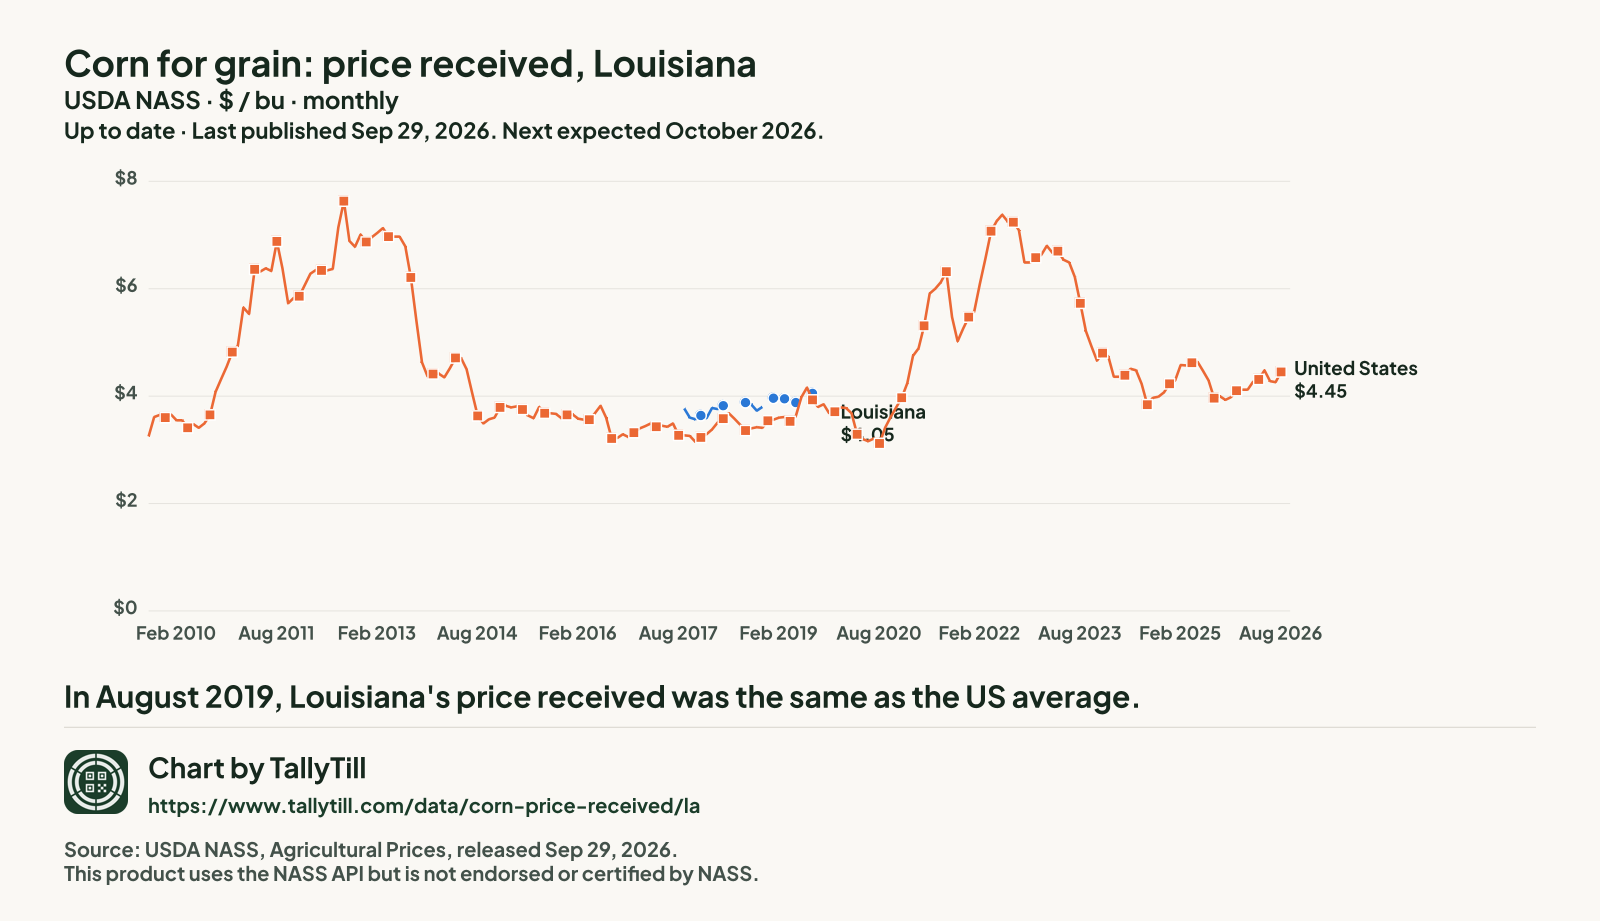
- In August 2019, Louisiana's price received was the same as the US average.
- From September 2017 to August 2019 it rose 7.4%, from $3.77 to $4.05 a bushel.
- Gaps are months with no Louisiana figure: NASS withheld the figure in May 2018, June 2018, December 2018, February 2019, April 2019, June 2019 and July 2019 to protect individual farms, and NASS had no figure available in July 2016, August 2016, September 2016, October 2016, November 2016, December 2016, January 2017, February 2017, March 2017, April 2017, May 2017, June 2017, July 2017, August 2017, September 2019, October 2019, November 2019, December 2019, January 2020, February 2020, March 2020, April 2020, May 2020, June 2020, July 2020, August 2020 and September 2020. Nothing is filled in.
Every figure behind this chart
| Month | Louisiana | United States |
|---|---|---|
| Aug 2026 | No figure | $4.45 |
| Jul 2026 | No figure | $4.26 |
| Jun 2026 | No figure | $4.28 |
| May 2026 | No figure | $4.48 |
| Apr 2026 | No figure | $4.31 |
| Mar 2026 | No figure | $4.27 |
| Feb 2026 | No figure | $4.12 |
| Jan 2026 | No figure | $4.12 |
| Dec 2025 | No figure | $4.10 |
| Nov 2025 | No figure | $3.98 |
| Oct 2025 | No figure | $3.93 |
| Sep 2025 | No figure | $4 |
| Aug 2025 | No figure | $3.96 |
| Jul 2025 | No figure | $4.29 |
| Jun 2025 | No figure | $4.47 |
| May 2025 | No figure | $4.64 |
| Apr 2025 | No figure | $4.62 |
| Mar 2025 | No figure | $4.57 |
| Feb 2025 | No figure | $4.58 |
| Jan 2025 | No figure | $4.29 |
| Dec 2024 | No figure | $4.23 |
| Nov 2024 | No figure | $4.07 |
| Oct 2024 | No figure | $3.99 |
| Sep 2024 | No figure | $3.97 |
| Aug 2024 | No figure | $3.84 |
| Jul 2024 | No figure | $4.23 |
| Jun 2024 | No figure | $4.48 |
| May 2024 | No figure | $4.51 |
| Apr 2024 | No figure | $4.39 |
| Mar 2024 | No figure | $4.36 |
| Feb 2024 | No figure | $4.36 |
| Jan 2024 | No figure | $4.74 |
| Dec 2023 | No figure | $4.80 |
| Nov 2023 | No figure | $4.66 |
| Oct 2023 | No figure | $4.93 |
| Sep 2023 | No figure | $5.21 |
| Aug 2023 | No figure | $5.73 |
| Jul 2023 | No figure | $6.22 |
| Jun 2023 | No figure | $6.49 |
| May 2023 | No figure | $6.54 |
| Apr 2023 | No figure | $6.70 |
| Mar 2023 | No figure | $6.67 |
| Feb 2023 | No figure | $6.80 |
| Jan 2023 | No figure | $6.63 |
| Dec 2022 | No figure | $6.58 |
| Nov 2022 | No figure | $6.49 |
| Oct 2022 | No figure | $6.49 |
| Sep 2022 | No figure | $7.09 |
| Aug 2022 | No figure | $7.24 |
| Jul 2022 | No figure | $7.25 |
| Jun 2022 | No figure | $7.38 |
| May 2022 | No figure | $7.26 |
| Apr 2022 | No figure | $7.07 |
| Mar 2022 | No figure | $6.56 |
| Feb 2022 | No figure | $6.09 |
| Jan 2022 | No figure | $5.58 |
| Dec 2021 | No figure | $5.47 |
| Nov 2021 | No figure | $5.26 |
| Oct 2021 | No figure | $5.02 |
| Sep 2021 | No figure | $5.47 |
| Aug 2021 | No figure | $6.32 |
| Jul 2021 | No figure | $6.12 |
| Jun 2021 | No figure | $6 |
| May 2021 | No figure | $5.91 |
| Apr 2021 | No figure | $5.31 |
| Mar 2021 | No figure | $4.89 |
| Feb 2021 | No figure | $4.75 |
| Jan 2021 | No figure | $4.24 |
| Dec 2020 | No figure | $3.97 |
| Nov 2020 | No figure | $3.79 |
| Oct 2020 | No figure | $3.61 |
| Sep 2020 | Not available | $3.41 |
| Aug 2020 | Not available | $3.12 |
| Jul 2020 | Not available | $3.21 |
| Jun 2020 | Not available | $3.16 |
| May 2020 | Not available | $3.20 |
| Apr 2020 | Not available | $3.29 |
| Mar 2020 | Not available | $3.68 |
| Feb 2020 | Not available | $3.78 |
| Jan 2020 | Not available | $3.79 |
| Dec 2019 | Not available | $3.71 |
| Nov 2019 | Not available | $3.68 |
| Oct 2019 | Not available | $3.85 |
| Sep 2019 | Not available | $3.80 |
| Aug 2019 | $4.05 | $3.93 |
| Jul 2019 | Withheld to protect individual farms | $4.16 |
| Jun 2019 | Withheld to protect individual farms | $3.98 |
| May 2019 | $3.88 | $3.63 |
| Apr 2019 | Withheld to protect individual farms | $3.53 |
| Mar 2019 | $3.95 | $3.61 |
| Feb 2019 | Withheld to protect individual farms | $3.60 |
| Jan 2019 | $3.96 | $3.56 |
| Dec 2018 | Withheld to protect individual farms | $3.54 |
| Nov 2018 | $3.80 | $3.41 |
| Oct 2018 | $3.73 | $3.42 |
| Sep 2018 | $3.85 | $3.40 |
| Aug 2018 | $3.88 | $3.36 |
| Jul 2018 | $3.88 | $3.47 |
| Jun 2018 | Withheld to protect individual farms | $3.58 |
| May 2018 | Withheld to protect individual farms | $3.68 |
| Apr 2018 | $3.82 | $3.58 |
| Mar 2018 | $3.76 | $3.51 |
| Feb 2018 | $3.78 | $3.38 |
| Jan 2018 | $3.59 | $3.29 |
| Dec 2017 | $3.64 | $3.23 |
| Nov 2017 | $3.57 | $3.15 |
| Oct 2017 | $3.60 | $3.26 |
| Sep 2017 | $3.77 | $3.27 |
| Aug 2017 | Not available | $3.27 |
| Jul 2017 | Not available | $3.49 |
| Jun 2017 | Not available | $3.43 |
| May 2017 | Not available | $3.45 |
| Apr 2017 | Not available | $3.43 |
| Mar 2017 | Not available | $3.49 |
| Feb 2017 | Not available | $3.44 |
| Jan 2017 | Not available | $3.40 |
| Dec 2016 | Not available | $3.32 |
| Nov 2016 | Not available | $3.24 |
| Oct 2016 | Not available | $3.29 |
| Sep 2016 | Not available | $3.22 |
| Aug 2016 | Not available | $3.21 |
| Jul 2016 | Not available | $3.60 |
| Jun 2016 | No figure | $3.82 |
| May 2016 | No figure | $3.68 |
| Apr 2016 | No figure | $3.56 |
| Mar 2016 | No figure | $3.56 |
| Feb 2016 | No figure | $3.58 |
| Jan 2016 | No figure | $3.66 |
| Dec 2015 | No figure | $3.65 |
| Nov 2015 | No figure | $3.59 |
| Oct 2015 | No figure | $3.67 |
| Sep 2015 | No figure | $3.68 |
| Aug 2015 | No figure | $3.68 |
| Jul 2015 | No figure | $3.80 |
| Jun 2015 | No figure | $3.59 |
| May 2015 | No figure | $3.64 |
| Apr 2015 | No figure | $3.75 |
| Mar 2015 | No figure | $3.81 |
| Feb 2015 | No figure | $3.79 |
| Jan 2015 | No figure | $3.82 |
| Dec 2014 | No figure | $3.79 |
| Nov 2014 | No figure | $3.60 |
| Oct 2014 | No figure | $3.57 |
| Sep 2014 | No figure | $3.49 |
| Aug 2014 | No figure | $3.63 |
| Jul 2014 | No figure | $4.06 |
| Jun 2014 | No figure | $4.50 |
| May 2014 | No figure | $4.71 |
| Apr 2014 | No figure | $4.71 |
| Mar 2014 | No figure | $4.52 |
| Feb 2014 | No figure | $4.35 |
| Jan 2014 | No figure | $4.42 |
| Dec 2013 | No figure | $4.41 |
| Nov 2013 | No figure | $4.37 |
| Oct 2013 | No figure | $4.63 |
| Sep 2013 | No figure | $5.40 |
| Aug 2013 | No figure | $6.21 |
| Jul 2013 | No figure | $6.79 |
| Jun 2013 | No figure | $6.97 |
| May 2013 | No figure | $6.97 |
| Apr 2013 | No figure | $6.97 |
| Mar 2013 | No figure | $7.13 |
| Feb 2013 | No figure | $7.04 |
| Jan 2013 | No figure | $6.96 |
| Dec 2012 | No figure | $6.87 |
| Nov 2012 | No figure | $7.01 |
| Oct 2012 | No figure | $6.78 |
| Sep 2012 | No figure | $6.89 |
| Aug 2012 | No figure | $7.63 |
| Jul 2012 | No figure | $7.14 |
| Jun 2012 | No figure | $6.37 |
| May 2012 | No figure | $6.34 |
| Apr 2012 | No figure | $6.34 |
| Mar 2012 | No figure | $6.35 |
| Feb 2012 | No figure | $6.28 |
| Jan 2012 | No figure | $6.07 |
| Dec 2011 | No figure | $5.86 |
| Nov 2011 | No figure | $5.83 |
| Oct 2011 | No figure | $5.73 |
| Sep 2011 | No figure | $6.38 |
| Aug 2011 | No figure | $6.88 |
| Jul 2011 | No figure | $6.33 |
| Jun 2011 | No figure | $6.38 |
| May 2011 | No figure | $6.32 |
| Apr 2011 | No figure | $6.36 |
| Mar 2011 | No figure | $5.53 |
| Feb 2011 | No figure | $5.65 |
| Jan 2011 | No figure | $4.94 |
| Dec 2010 | No figure | $4.82 |
| Nov 2010 | No figure | $4.55 |
| Oct 2010 | No figure | $4.32 |
| Sep 2010 | No figure | $4.08 |
| Aug 2010 | No figure | $3.65 |
| Jul 2010 | No figure | $3.49 |
| Jun 2010 | No figure | $3.41 |
| May 2010 | No figure | $3.48 |
| Apr 2010 | No figure | $3.41 |
| Mar 2010 | No figure | $3.55 |
| Feb 2010 | No figure | $3.55 |
| Jan 2010 | No figure | $3.66 |
| Dec 2009 | No figure | $3.60 |
| Nov 2009 | No figure | $3.65 |
| Oct 2009 | No figure | $3.61 |
| Sep 2009 | No figure | $3.25 |
ComparePut this series on one chart with another, and see whether the two can be compared.
Share chartGet a link and a preview picture of this chart to share.
Embed this chartGet the code to show this chart on your own website.
Source: USDA National Agricultural Statistics Service (NASS), Agricultural Prices Survey. State and US estimates released Sep 29, 2026. Quick Stats item "CORN, GRAIN - PRICE RECEIVED, MEASURED IN $ / BU". Retrieved Oct 25, 2026; snapshot 2026-10-25.1. Dollars as published, not adjusted for inflation. This product uses the NASS API but is not endorsed or certified by NASS.
What this measures
It is the average price farmers got for corn for grain they sold that month, as reported to USDA's monthly prices survey.