Farm & food prices · Production and land
Oats: yield: Montana
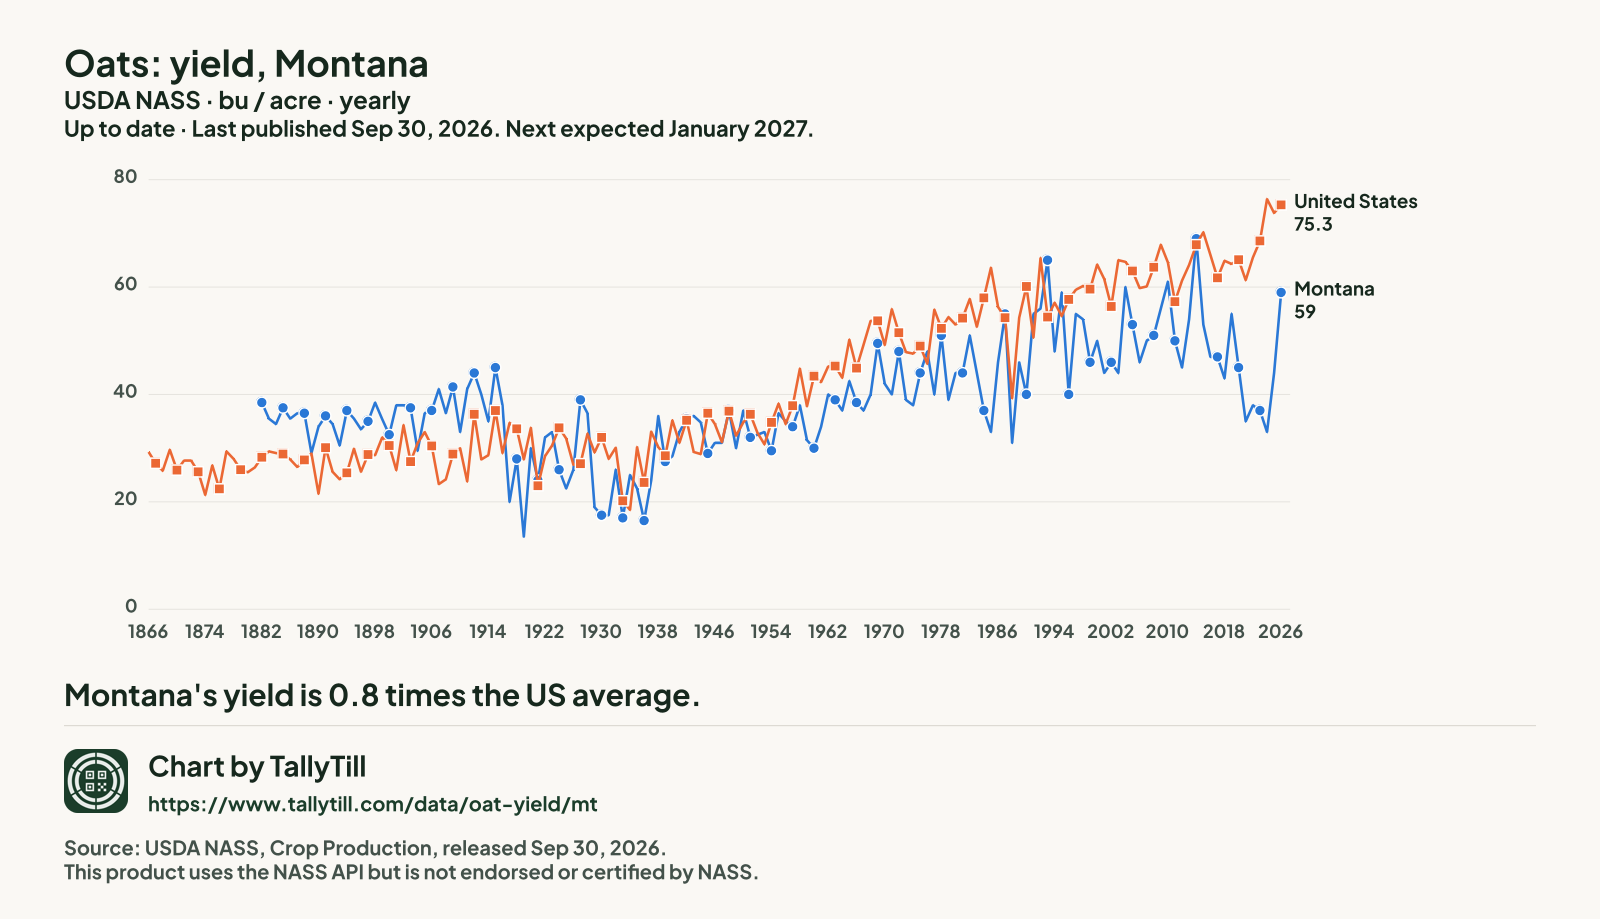
The average yield per acre of oats, from USDA's yearly crop production summary.
Up to dateYearly. USDA usually publishes in January. Last published Sep 30, 2026. Next expected January 2027.
The latest figures and how they have changed
Montana, 2026
59 bushels an acre
Up 34.1% from 44 bushels in 2025
United States, 2026
75.30 bushels an acre
Up 2.0% from 73.80 bushels in 2025
MontanaUnited States
 Chart by TallyTill · tallytill.com
View the dataOpen every figure behind this chart in a table.Save imageSave this chart as a picture.
What the numbers say
- Montana's yield is 0.8 times the US average.
- Since 1882 it has risen 53.2%, from 38.50 bushels to 59 bushels an acre.
Every figure behind this chart
| Year | Montana | United States |
|---|---|---|
| 2026 | 59 | 75.3 |
| 2025 | 44 | 73.8 |
| 2024 | 33 | 76.4 |
| 2023 | 37 | 68.6 |
| 2022 | 38 | 65.5 |
| 2021 | 35 | 61.3 |
| 2020 | 45 | 65.1 |
| 2019 | 55 | 64.3 |
| 2018 | 43 | 64.9 |
| 2017 | 47 | 61.7 |
| 2016 | 47 | 66 |
| 2015 | 53 | 70.2 |
| 2014 | 69 | 67.9 |
| 2013 | 54 | 64.1 |
| 2012 | 45 | 61.2 |
| 2011 | 50 | 57.3 |
| 2010 | 61 | 64.6 |
| 2009 | 56 | 67.9 |
| 2008 | 51 | 63.7 |
| 2007 | 50 | 60.1 |
| 2006 | 46 | 59.8 |
| 2005 | 53 | 63 |
| 2004 | 60 | 64.7 |
| 2003 | 44 | 65 |
| 2002 | 46 | 56.4 |
| 2001 | 44 | 61.5 |
| 2000 | 50 | 64.2 |
| 1999 | 46 | 59.6 |
| 1998 | 54 | 60.2 |
| 1997 | 55 | 59.5 |
| 1996 | 40 | 57.7 |
| 1995 | 59 | 54.6 |
| 1994 | 48 | 57.1 |
| 1993 | 65 | 54.4 |
| 1992 | 56 | 65.4 |
| 1991 | 55 | 50.6 |
| 1990 | 40 | 60.1 |
| 1989 | 46 | 54.3 |
| 1988 | 31 | 39.3 |
| 1987 | 55 | 54.3 |
| 1986 | 46 | 56.3 |
| 1985 | 33 | 63.6 |
| 1984 | 37 | 58 |
| 1983 | 44 | 52.6 |
| 1982 | 51 | 57.8 |
| 1981 | 44 | 54.2 |
| 1980 | 44 | 53 |
| 1979 | 39 | 54.4 |
| 1978 | 51 | 52.3 |
| 1977 | 40 | 55.8 |
| 1976 | 48 | 45.7 |
| 1975 | 44 | 49 |
| 1974 | 38 | 47.6 |
| 1973 | 39 | 47.9 |
| 1972 | 48 | 51.5 |
| 1971 | 40 | 55.9 |
| 1970 | 42 | 49.2 |
| 1969 | 49.5 | 53.7 |
| 1968 | 40 | 53.7 |
| 1967 | 37 | 49.3 |
| 1966 | 38.5 | 44.9 |
| 1965 | 42.5 | 50.2 |
| 1964 | 37 | 43.1 |
| 1963 | 39 | 45.3 |
| 1962 | 40 | 45.2 |
| 1961 | 34 | 42.3 |
| 1960 | 30 | 43.4 |
| 1959 | 31.5 | 37.8 |
| 1958 | 38 | 44.8 |
| 1957 | 34 | 37.9 |
| 1956 | 35 | 34.5 |
| 1955 | 36.5 | 38.3 |
| 1954 | 29.5 | 34.8 |
| 1953 | 33 | 30.7 |
| 1952 | 32.5 | 32.9 |
| 1951 | 32 | 36.3 |
| 1950 | 37 | 34.8 |
| 1949 | 30 | 32.3 |
| 1948 | 37 | 36.9 |
| 1947 | 31 | 31.1 |
| 1946 | 31 | 34.5 |
| 1945 | 29 | 36.5 |
| 1944 | 34.8 | 28.9 |
| 1943 | 36 | 29.3 |
| 1942 | 35.5 | 35.2 |
| 1941 | 33 | 31 |
| 1940 | 28.5 | 35.2 |
| 1939 | 27.5 | 28.6 |
| 1938 | 36 | 30.2 |
| 1937 | 24 | 33.1 |
| 1936 | 16.5 | 23.6 |
| 1935 | 22.5 | 30.2 |
| 1934 | 25 | 18.5 |
| 1933 | 17 | 20.2 |
| 1932 | 26 | 30.1 |
| 1931 | 17.5 | 28 |
| 1930 | 17.5 | 32 |
| 1929 | 19 | 29.2 |
| 1928 | 36.5 | 32.7 |
| 1927 | 39 | 27.1 |
| 1926 | 26 | 26.9 |
| 1925 | 22.5 | 31.8 |
| 1924 | 26 | 33.8 |
| 1923 | 33 | 30.5 |
| 1922 | 32 | 28.5 |
| 1921 | 24 | 23 |
| 1920 | 30 | 33.8 |
| 1919 | 13.5 | 27.9 |
| 1918 | 28 | 33.6 |
| 1917 | 20 | 34.7 |
| 1916 | 38 | 29.1 |
| 1915 | 45 | 37 |
| 1914 | 35 | 28.7 |
| 1913 | 40 | 27.9 |
| 1912 | 44 | 36.3 |
| 1911 | 41 | 23.8 |
| 1910 | 33 | 30 |
| 1909 | 41.4 | 28.9 |
| 1908 | 36.5 | 24.2 |
| 1907 | 41 | 23.3 |
| 1906 | 37 | 30.4 |
| 1905 | 36.5 | 33 |
| 1904 | 29.5 | 30.9 |
| 1903 | 37.5 | 27.5 |
| 1902 | 38 | 34.3 |
| 1901 | 38 | 25.9 |
| 1900 | 32.5 | 30.5 |
| 1899 | 35.4 | 32 |
| 1898 | 38.5 | 28.7 |
| 1897 | 35 | 28.8 |
| 1896 | 33.5 | 25.6 |
| 1895 | 35.5 | 29.9 |
| 1894 | 37 | 25.4 |
| 1893 | 30.5 | 24.2 |
| 1892 | 34.5 | 25.6 |
| 1891 | 36 | 30.1 |
| 1890 | 34 | 21.5 |
| 1889 | 29.1 | 29 |
| 1888 | 36.5 | 27.8 |
| 1887 | 36.5 | 26.5 |
| 1886 | 35.5 | 27.9 |
| 1885 | 37.5 | 28.9 |
| 1884 | 34.5 | 29.1 |
| 1883 | 35.5 | 29.4 |
| 1882 | 38.5 | 28.3 |
| 1881 | No figure | 26.4 |
| 1880 | No figure | 25.5 |
| 1879 | No figure | 26 |
| 1878 | No figure | 28 |
| 1877 | No figure | 29.4 |
| 1876 | No figure | 22.4 |
| 1875 | No figure | 26.8 |
| 1874 | No figure | 21.3 |
| 1873 | No figure | 25.6 |
| 1872 | No figure | 27.7 |
| 1871 | No figure | 27.7 |
| 1870 | No figure | 25.9 |
| 1869 | No figure | 29.7 |
| 1868 | No figure | 25.8 |
| 1867 | No figure | 27.2 |
| 1866 | No figure | 29.3 |
ComparePut this series on one chart with another, and see whether the two can be compared.
Share chartGet a link and a preview picture of this chart to share.
Embed this chartGet the code to show this chart on your own website.
Source: USDA National Agricultural Statistics Service (NASS), Crop Production Survey. State and US estimates released Sep 30, 2026. Quick Stats item "OATS - YIELD, MEASURED IN BU / ACRE". Retrieved Oct 23, 2026; snapshot 2026-10-23.1. This product uses the NASS API but is not endorsed or certified by NASS.
What this measures
It is the bushels of oats harvested from an acre, averaged over the acres harvested.