Farm & food prices · Food prices in stores
Wholesale wheat flour: change in producer prices: United States
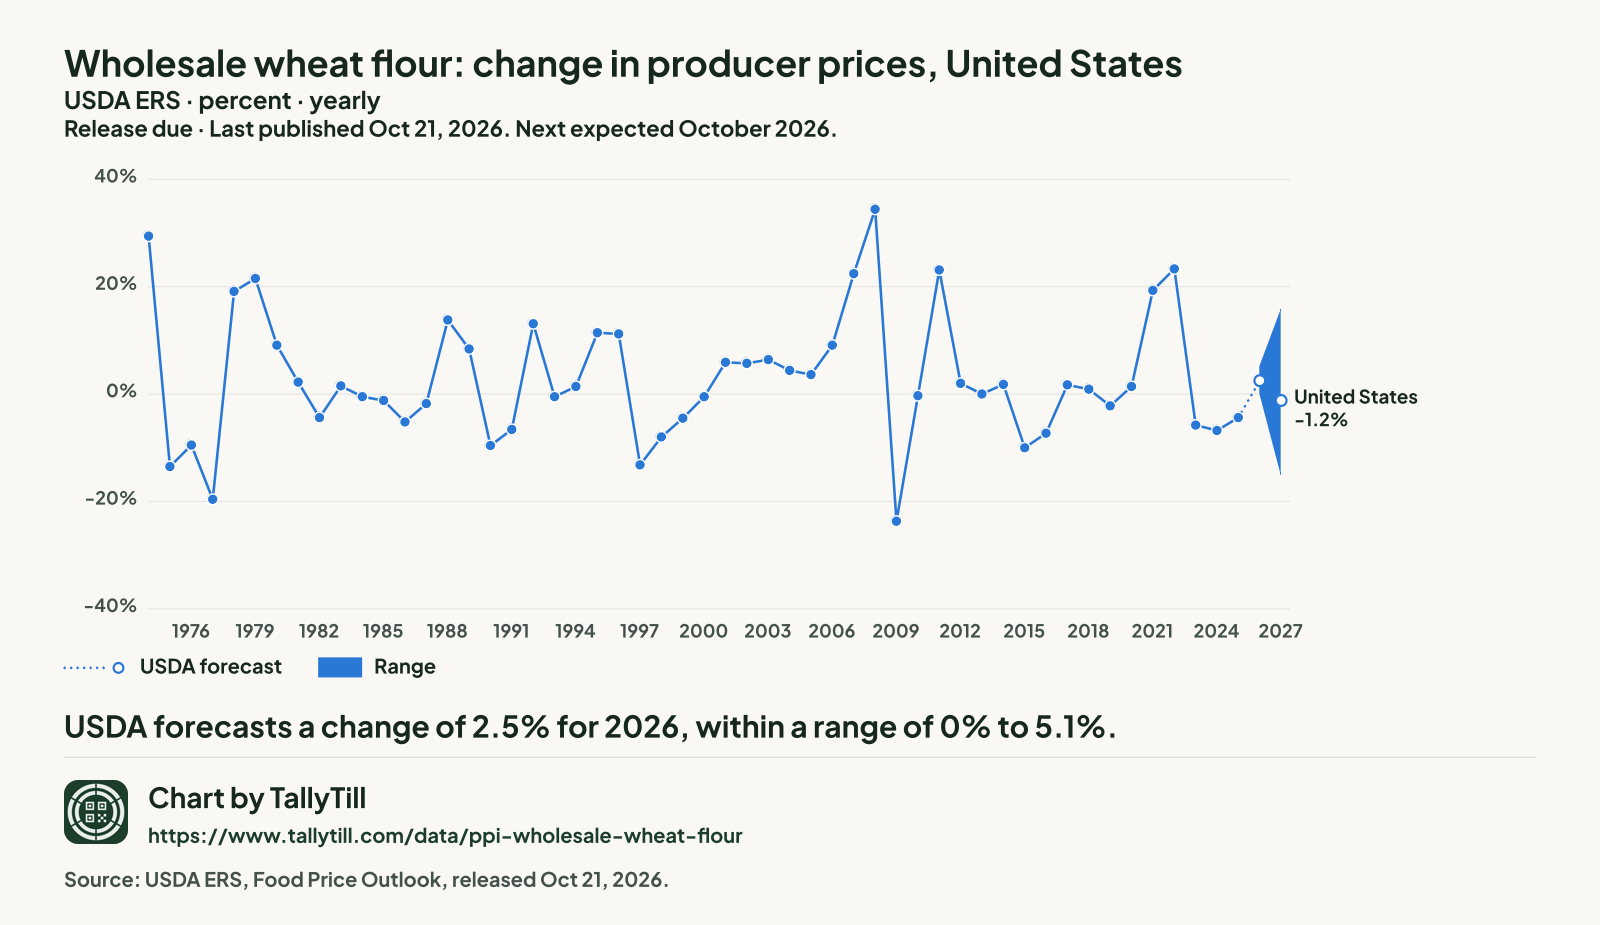
How much producer prices for wholesale wheat flour changed from the year before, as measured by the producer price index, with USDA's forecast for this year and next.
Release dueMonthly. USDA usually publishes around the 25th. Last published Oct 21, 2026. Next expected October 2026.
The latest figures and how they have changed
United States, 2025
-4.4%
United StatesUSDA forecastRange
 Chart by TallyTill · tallytill.com
View the dataOpen every figure behind this chart in a table.Save imageSave this chart as a picture.
What the numbers say
- USDA forecasts a change of 2.5% for 2026, within a range of 0% to 5.1%.
- USDA forecasts a change of -1.2% for 2027, within a range of -15.1% to 15.7%.
Every figure behind this chart
| Year | United States |
|---|---|
| 2027 | -1.2% (USDA forecast, range -15.1% to 15.7%) |
| 2026 | 2.5% (USDA forecast, range 0% to 5.1%) |
| 2025 | -4.4% |
| 2024 | -6.8% |
| 2023 | -5.8% |
| 2022 | 23.3% |
| 2021 | 19.3% |
| 2020 | 1.4% |
| 2019 | -2.2% |
| 2018 | 0.9% |
| 2017 | 1.7% |
| 2016 | -7.3% |
| 2015 | -10% |
| 2014 | 1.8% |
| 2013 | 0% |
| 2012 | 2% |
| 2011 | 23.1% |
| 2010 | -0.3% |
| 2009 | -23.7% |
| 2008 | 34.4% |
| 2007 | 22.4% |
| 2006 | 9.1% |
| 2005 | 3.6% |
| 2004 | 4.4% |
| 2003 | 6.4% |
| 2002 | 5.7% |
| 2001 | 5.9% |
| 2000 | -0.5% |
| 1999 | -4.5% |
| 1998 | -8% |
| 1997 | -13.2% |
| 1996 | 11.2% |
| 1995 | 11.4% |
| 1994 | 1.4% |
| 1993 | -0.5% |
| 1992 | 13.1% |
| 1991 | -6.6% |
| 1990 | -9.6% |
| 1989 | 8.4% |
| 1988 | 13.8% |
| 1987 | -1.8% |
| 1986 | -5.2% |
| 1985 | -1.2% |
| 1984 | -0.5% |
| 1983 | 1.5% |
| 1982 | -4.4% |
| 1981 | 2.2% |
| 1980 | 9.1% |
| 1979 | 21.5% |
| 1978 | 19.1% |
| 1977 | -19.6% |
| 1976 | -9.5% |
| 1975 | -13.5% |
| 1974 | 29.4% |
ComparePut this series on one chart with another, and see whether the two can be compared.
Share chartGet a link and a preview picture of this chart to share.
Embed this chartGet the code to show this chart on your own website.
Source: USDA Economic Research Service (ERS), Food Price Outlook. US estimates released Oct 21, 2026. Retrieved Oct 21, 2026; snapshot 2026-10-21.1.
What this measures
It is the yearly percent change in what producers are paid, not a price: it is measured before the product reaches a store shelf.