Farm & food prices · Farm costs and income
Total production expenses: Georgia
What US farms spent to produce their crops and livestock each year, in billions of dollars, with USDA's forecast for the nation's current year.
Up to dateThree times a year: in February, around the start of September and around the start of December. Last published Sep 3, 2026. Next expected November 2026.
The latest figures and how they have changed
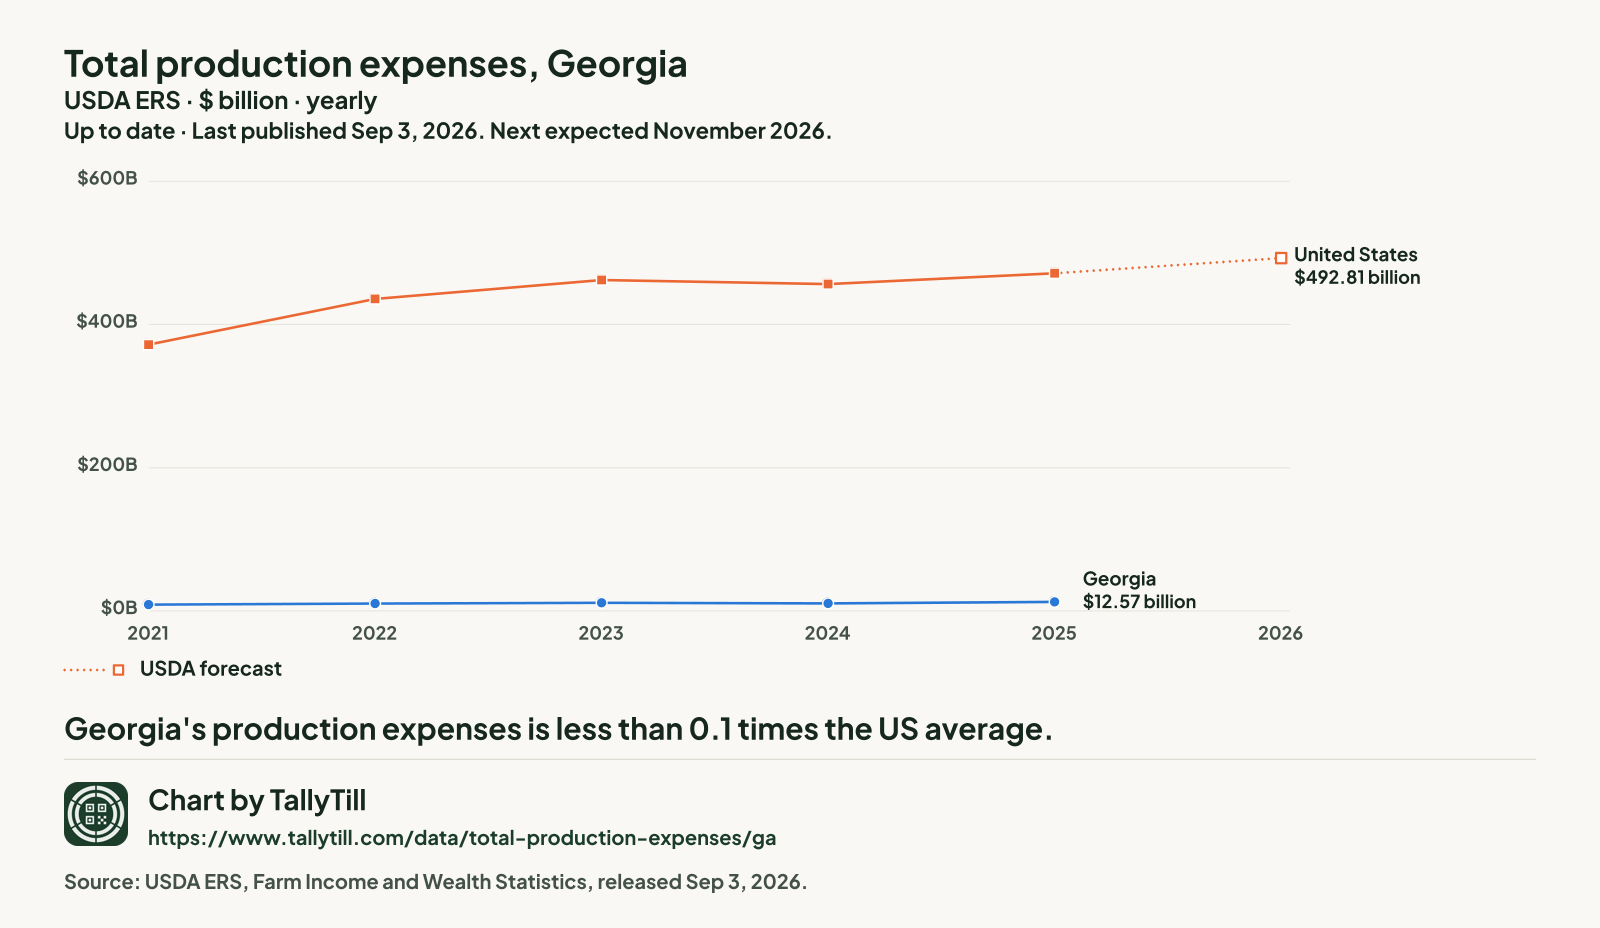
Georgia, 2025
$12.57 billion
Up 19.6% from $10.51 billion in 2024
United States, 2025
$471.57 billion
Up 3.3% from $456.56 billion in 2024
GeorgiaUnited StatesUSDA forecast
 Chart by TallyTill · tallytill.com
View the dataOpen every figure behind this chart in a table.Save imageSave this chart as a picture.
What the numbers say
- Georgia's production expenses is less than 0.1 times the US average.
- Since 2021 it has risen 43.9%, from $8.73 billion to $12.57 billion.
Every figure behind this chart
| Year | Georgia | United States |
|---|---|---|
| 2026 | No figure | $492.81 billion (USDA forecast) |
| 2025 | $12.57 billion | $471.57 billion |
| 2024 | $10.51 billion | $456.56 billion |
| 2023 | $11.25 billion | $462.12 billion |
| 2022 | $10.29 billion | $435.74 billion |
| 2021 | $8.73 billion | $371.93 billion |
ComparePut this series on one chart with another, and see whether the two can be compared.
Share chartGet a link and a preview picture of this chart to share.
Embed this chartGet the code to show this chart on your own website.
Source: USDA Economic Research Service (ERS), Farm Income and Wealth Statistics. State and US estimates released Sep 3, 2026. Retrieved Oct 21, 2026; snapshot 2026-10-21.1. Dollars as published, not adjusted for inflation.
What this measures
It adds up feed, fertilizer, fuel, labor, interest, rent and the other costs of farming, and the nation's latest year is a USDA forecast.