Farm & food prices · Prices farmers receive
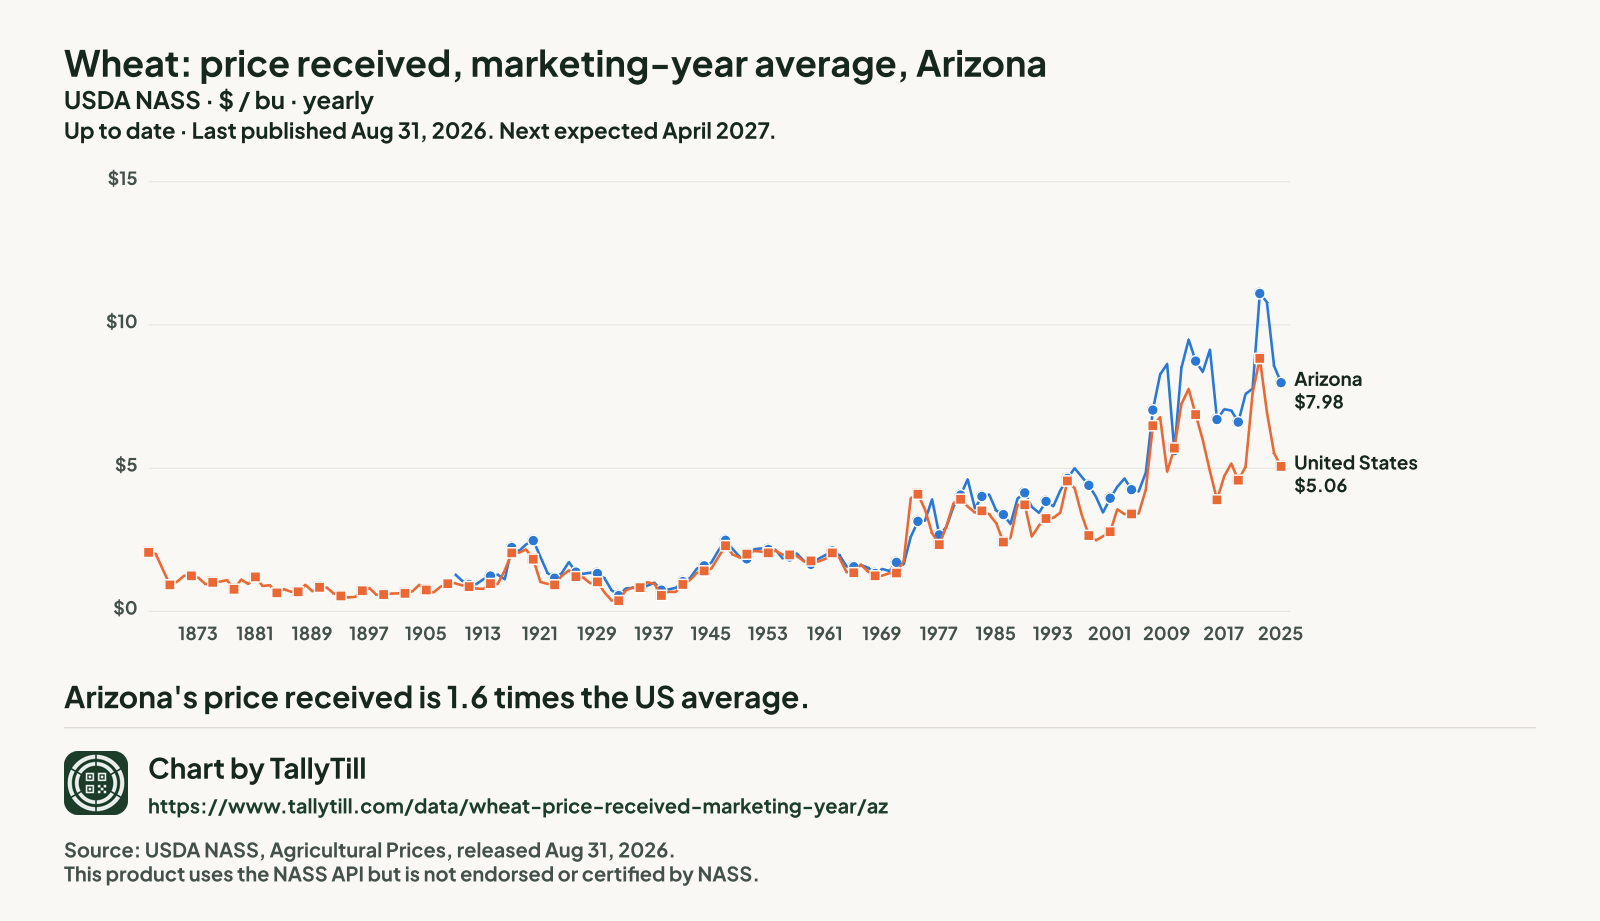
Wheat: price received, marketing-year average: Arizona
The average price farmers received per bushel for wheat over each marketing year, from USDA's agricultural prices survey.
Up to dateYearly (marketing-year average). Last published Aug 31, 2026. Next expected April 2027.
The latest figures and how they have changed
Arizona, 2025
$7.98 a bushel
Down 6.9% from $8.57 in 2024
United States, 2025
$5.06 a bushel
Down 8.3% from $5.52 in 2024
ArizonaUnited States
 Chart by TallyTill · tallytill.com
View the dataOpen every figure behind this chart in a table.Save imageSave this chart as a picture.
What the numbers say
- Arizona's price received is 1.6 times the US average.
- Since 1909 it has risen 513.8%, from $1.30 to $7.98 a bushel.
Every figure behind this chart
| Year | Arizona | United States |
|---|---|---|
| 2025 | $7.98 | $5.06 |
| 2024 | $8.57 | $5.52 |
| 2023 | $10.80 | $6.96 |
| 2022 | $11.10 | $8.83 |
| 2021 | $7.78 | $7.63 |
| 2020 | $7.59 | $5.05 |
| 2019 | $6.61 | $4.58 |
| 2018 | $7.01 | $5.16 |
| 2017 | $7.06 | $4.72 |
| 2016 | $6.70 | $3.89 |
| 2015 | $9.14 | $4.89 |
| 2014 | $8.36 | $5.99 |
| 2013 | $8.74 | $6.87 |
| 2012 | $9.49 | $7.77 |
| 2011 | $8.50 | $7.24 |
| 2010 | $5.61 | $5.70 |
| 2009 | $8.64 | $4.87 |
| 2008 | $8.27 | $6.78 |
| 2007 | $7.03 | $6.48 |
| 2006 | $4.85 | $4.26 |
| 2005 | $4.19 | $3.42 |
| 2004 | $4.25 | $3.40 |
| 2003 | $4.64 | $3.40 |
| 2002 | $4.35 | $3.56 |
| 2001 | $3.95 | $2.78 |
| 2000 | $3.45 | $2.62 |
| 1999 | $4 | $2.48 |
| 1998 | $4.40 | $2.65 |
| 1997 | $4.70 | $3.38 |
| 1996 | $5 | $4.30 |
| 1995 | $4.64 | $4.55 |
| 1994 | $4.22 | $3.45 |
| 1993 | $3.67 | $3.26 |
| 1992 | $3.84 | $3.24 |
| 1991 | $3.44 | $3 |
| 1990 | $3.65 | $2.61 |
| 1989 | $4.14 | $3.72 |
| 1988 | $3.94 | $3.72 |
| 1987 | $3.05 | $2.57 |
| 1986 | $3.38 | $2.42 |
| 1985 | $3.52 | $3.08 |
| 1984 | $4.08 | $3.39 |
| 1983 | $4.01 | $3.51 |
| 1982 | $3.60 | $3.45 |
| 1981 | $4.61 | $3.66 |
| 1980 | $4.06 | $3.91 |
| 1979 | $3.66 | $3.78 |
| 1978 | $2.94 | $2.97 |
| 1977 | $2.67 | $2.33 |
| 1976 | $3.91 | $2.73 |
| 1975 | $3.17 | $3.55 |
| 1974 | $3.14 | $4.09 |
| 1973 | $2.60 | $3.95 |
| 1972 | $1.64 | $1.76 |
| 1971 | $1.71 | $1.34 |
| 1970 | $1.41 | $1.33 |
| 1969 | $1.48 | $1.25 |
| 1968 | $1.32 | $1.24 |
| 1967 | $1.52 | $1.39 |
| 1966 | $1.62 | $1.63 |
| 1965 | $1.56 | $1.35 |
| 1964 | $1.57 | $1.37 |
| 1963 | $1.96 | $1.85 |
| 1962 | $2.11 | $2.04 |
| 1961 | $1.96 | $1.83 |
| 1960 | $1.83 | $1.74 |
| 1959 | $1.64 | $1.76 |
| 1958 | $1.76 | $1.75 |
| 1957 | $2.02 | $1.93 |
| 1956 | $1.90 | $1.97 |
| 1955 | $1.85 | $1.98 |
| 1954 | $2.15 | $2.12 |
| 1953 | $2.16 | $2.04 |
| 1952 | $2.20 | $2.09 |
| 1951 | $2.17 | $2.11 |
| 1950 | $1.83 | $2 |
| 1949 | $1.90 | $1.88 |
| 1948 | $2.17 | $1.98 |
| 1947 | $2.48 | $2.29 |
| 1946 | $2.13 | $1.90 |
| 1945 | $1.70 | $1.49 |
| 1944 | $1.59 | $1.41 |
| 1943 | $1.50 | $1.35 |
| 1942 | $1.16 | $1.09 |
| 1941 | $1.04 | $0.94 |
| 1940 | $0.82 | $0.67 |
| 1939 | $0.77 | $0.69 |
| 1938 | $0.74 | $0.56 |
| 1937 | $1 | $0.96 |
| 1936 | $0.89 | $1.02 |
| 1935 | $0.82 | $0.83 |
| 1934 | $0.82 | $0.84 |
| 1933 | $0.80 | $0.74 |
| 1932 | $0.55 | $0.38 |
| 1931 | $0.74 | $0.38 |
| 1930 | $1.16 | $0.66 |
| 1929 | $1.32 | $1.03 |
| 1928 | $1.35 | $0.99 |
| 1927 | $1.31 | $1.18 |
| 1926 | $1.37 | $1.21 |
| 1925 | $1.72 | $1.43 |
| 1924 | $1.33 | $1.24 |
| 1923 | $1.16 | $0.92 |
| 1922 | $1.34 | $0.96 |
| 1921 | $1.91 | $1.03 |
| 1920 | $2.47 | $1.82 |
| 1919 | $2.34 | $2.16 |
| 1918 | $2.11 | $2.05 |
| 1917 | $2.23 | $2.04 |
| 1916 | $1.12 | $1.43 |
| 1915 | $1.28 | $0.96 |
| 1914 | $1.23 | $0.97 |
| 1913 | $1.12 | $0.79 |
| 1912 | $0.95 | $0.80 |
| 1911 | $0.94 | $0.87 |
| 1910 | $1.07 | $0.91 |
| 1909 | $1.30 | $0.99 |
| 1908 | No figure | $0.97 |
| 1907 | No figure | $0.87 |
| 1906 | No figure | $0.66 |
| 1905 | No figure | $0.75 |
| 1904 | No figure | $0.93 |
| 1903 | No figure | $0.69 |
| 1902 | No figure | $0.63 |
| 1901 | No figure | $0.63 |
| 1900 | No figure | $0.62 |
| 1899 | No figure | $0.59 |
| 1898 | No figure | $0.58 |
| 1897 | No figure | $0.81 |
| 1896 | No figure | $0.72 |
| 1895 | No figure | $0.51 |
| 1894 | No figure | $0.49 |
| 1893 | No figure | $0.53 |
| 1892 | No figure | $0.62 |
| 1891 | No figure | $0.83 |
| 1890 | No figure | $0.84 |
| 1889 | No figure | $0.70 |
| 1888 | No figure | $0.93 |
| 1887 | No figure | $0.68 |
| 1886 | No figure | $0.69 |
| 1885 | No figure | $0.77 |
| 1884 | No figure | $0.65 |
| 1883 | No figure | $0.91 |
| 1882 | No figure | $0.89 |
| 1881 | No figure | $1.20 |
| 1880 | No figure | $0.95 |
| 1879 | No figure | $1.11 |
| 1878 | No figure | $0.77 |
| 1877 | No figure | $1.09 |
| 1876 | No figure | $1.04 |
| 1875 | No figure | $1.01 |
| 1874 | No figure | $0.95 |
| 1873 | No figure | $1.17 |
| 1872 | No figure | $1.24 |
| 1871 | No figure | $1.25 |
| 1870 | No figure | $1.04 |
| 1869 | No figure | $0.92 |
| 1868 | No figure | $1.46 |
| 1867 | No figure | $2.01 |
| 1866 | No figure | $2.06 |
ComparePut this series on one chart with another, and see whether the two can be compared.
Share chartGet a link and a preview picture of this chart to share.
Embed this chartGet the code to show this chart on your own website.
Source: USDA National Agricultural Statistics Service (NASS), Agricultural Prices Survey. State estimates released Aug 31, 2026; US estimates released Jun 29, 2026. Quick Stats item "WHEAT - PRICE RECEIVED, MEASURED IN $ / BU". Retrieved Oct 20, 2026; snapshot 2026-10-20.1. Dollars as published, not adjusted for inflation. This product uses the NASS API but is not endorsed or certified by NASS.
What this measures
It is USDA's average for a whole marketing year, weighted by how much of it sold in each month of the marketing year, so it is not the average of the monthly prices.